LogCheck User Manual
This is the complete guide to LogCheck. It covers installation, your first analysis, every page in the interface, custom rules, history and comparison, reports and support packages, privacy, settings, common workflows, and troubleshooting.
LogCheck is a local, editor-only Unreal Engine plugin. It reads your logs, never uploads anything, never modifies your project, and never applies fixes on its own.
1. Introduction
LogCheck turns large Unreal Engine logs into a short, reviewable summary: a detected outcome, a single Primary Diagnosis, ranked alternatives, grouped evidence, and a list of significant messages that no rule recognised. You stay in control the whole time — LogCheck reads your sources read-only and only writes files (history, reports) when you ask it to, to a location you choose.
Throughout this manual, a few terms are used precisely:
- A Source is one log you loaded (a file or pasted text). An Analysis can span several sources.
- A Session is one run detected inside a log (for example, a single packaging run).
- A Diagnostic is a grouped, recognised issue. A Rule Match is one raw recognised occurrence that feeds into a diagnostic.
- An Unknown Issue is a significant message that no rule matched. It is not a confirmed diagnosis.
2. Requirements and Compatibility
- Unreal Engine: 5.5, 5.6, 5.7, or 5.8. UE 5.8.1 is the primary environment used for final validation.
- Editor-only: LogCheck is a C++ editor plugin. It loads in the Unreal Editor and is not intended for packaged/shipping runtime builds.
- Project type: because it is a C++ plugin, your project must be able to compile C++ (you need the usual Unreal C++ toolchain for your platform).
- Platform: LogCheck has been developed and validated on Windows desktop editors. It does not depend on platform-specific runtime features, but only desktop editor use is claimed.
LogCheck does not support future Unreal versions that have not been tested.
3. Installation
LogCheck installs as a project plugin.
- Copy the
LogCheckfolder into your project'sPluginsdirectory:YourProject/Plugins/LogCheck. - If your project is Blueprint-only, convert it to a C++ project first (add any C++ class from the editor), so the plugin's modules can be compiled.
- Right-click your
.uprojectand choose Generate Visual Studio project files (or the equivalent for your IDE), if needed. - Build the project from your IDE, or let the editor compile the plugin on the next launch.
- Launch the Unreal Editor. If prompted to rebuild missing modules, choose to rebuild.
- Confirm LogCheck loaded (see the next section). If you want, verify it in Edit → Plugins under the ECal Studios category.
Do not copy compiled Binaries from a different engine version. If you move the plugin
between engine versions, delete its Binaries and Intermediate folders and let it
recompile.
4. Opening LogCheck
Open LogCheck from the editor's main menu:
Tools → ECal Studios → LogCheck
LogCheck opens as a dockable tab with the LogCheck icon. You can dock it, undock it, or drag it alongside other editor panels like any Unreal tab.
5. Interface Overview
Every page shares the same shell:
- A header with the LogCheck icon, the product name, a status pill showing the current outcome (or "Diagnostics" before an analysis), and the active source, plugin version, and engine version. Settings and Documentation buttons sit on the right.
- A grouped navigation panel on the left: Workflow, Evidence, History & Rules, Output, and Product. Pages that need an analysis are disabled until you run one, with a tooltip explaining why.
- A status strip at the bottom with line count, source size, mode, sessions, diagnostic groups, analysis duration, and an evidence-gap indicator.
6. First Analysis
You can complete your first analysis in under five minutes.
- Open LogCheck (Tools → ECal Studios → LogCheck).
- On the Start page, choose a log source. To try it immediately, choose Load Synthetic Sample.
- Confirm the Analysis Mode (leave it on Auto Detect unless you have a reason to change it).
- Select Analyze Log.
- Read the detected Outcome at the top of the Summary page.
- Read the Primary Diagnosis — the single most likely actionable cause.
- Use Open Diagnostic, Open Root Causes, or Open Primary Evidence in Raw Log to see the evidence behind it.
- If Unknown Issues are present, open them to review messages no rule matched.
- When useful, save the analysis to History or export a report.
The synthetic sample produces a Packaging failed outcome with a clear primary diagnosis (a C++ "cannot open include file" error) plus several packaging summary messages — a good tour of what a real failing log looks like in LogCheck.
7. Choosing Input
The Start page offers every input method:
| Method | What it does |
|---|---|
| Paste Log Text | Analyze text you paste directly. |
| Load Log File | Analyze a single .log or .txt file. |
| Load Multiple Files | Analyze several files together as one analysis. |
| Load Latest Project Log | Load your project's most recent editor log. |
| Browse Recent Project Logs | Pick from recent project logs. |
| Load Latest AutomationTool Log | Load the most recent UAT log. |
| Browse Recent AutomationTool Logs | Pick from recent UAT logs. |
| Load Synthetic Sample | Load the built-in demonstration log. |
| Drag and drop | Drop one or more .log/.txt files onto the drop area. |
Notes:
- You can combine multiple sources; they are analyzed together, and source order is preserved.
- LogCheck detects text encoding automatically.
- Sources are read read-only — LogCheck never modifies the files you load.
- Unsupported file types dropped onto the page (folders, binaries) are ignored.
Selected sources appear in the Selected sources list, where you can remove one or clear them all.
8. Analysis Modes and Sessions
An Analysis Mode tells LogCheck what kind of log it is looking at (for example, Packaging/Cook, C++ Build, Blueprint, Plugin/Module, Editor Startup, or Crash/Fatal). Leave it on Auto Detect in most cases; you can override it if detection is wrong or you want to focus on a specific kind of failure.
A Session is a single run detected inside a log. Many logs contain more than one session (for example, an editor log that also captured a build). LogCheck identifies sessions, focuses diagnosis on the failing session, and lets you switch sessions when browsing evidence. A Source and a Session are different things: one source can contain several sessions.
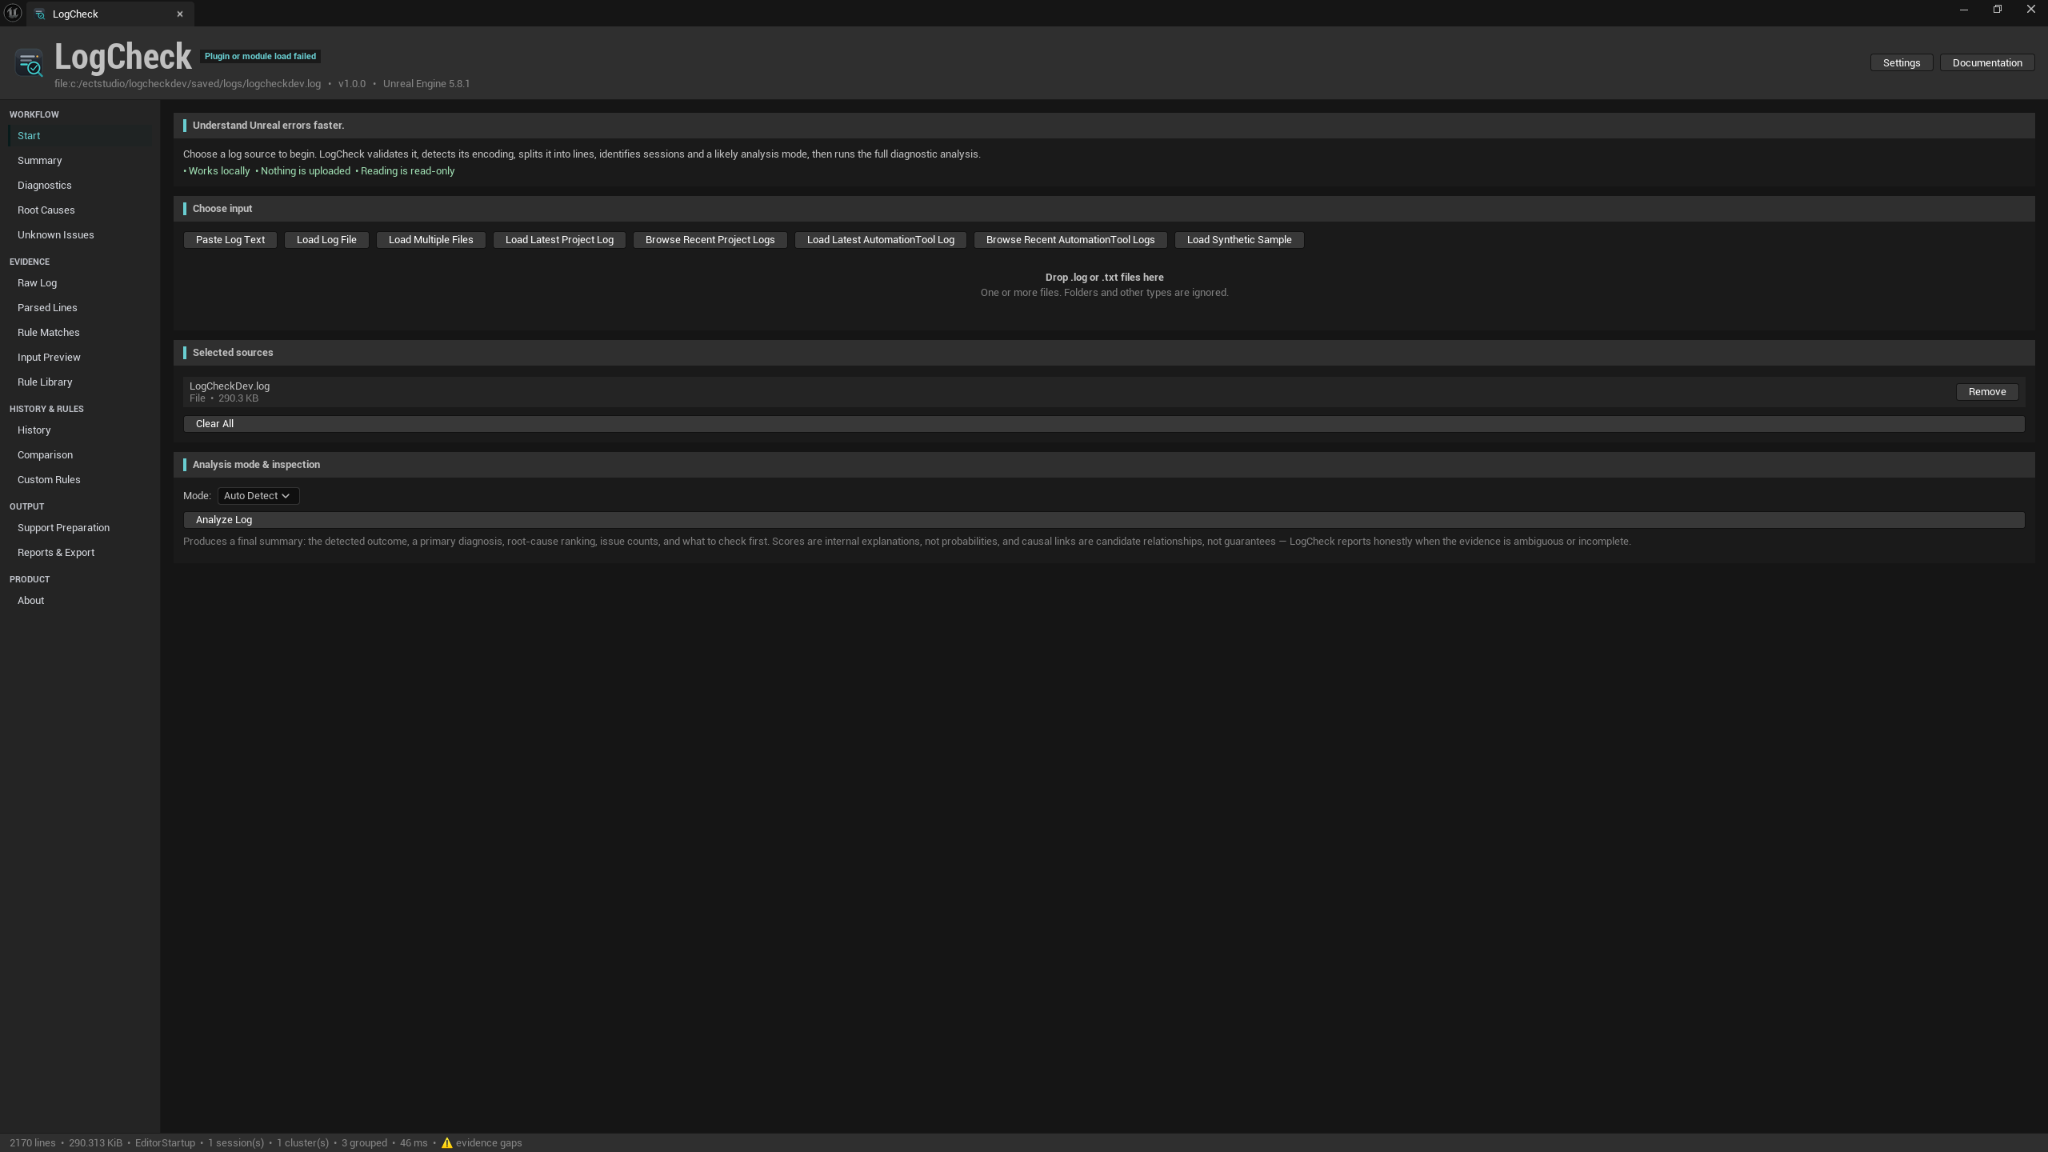
9. Start Page
The Start page is where every analysis begins. It contains:
- the input methods described above;
- the Selected sources list, with Remove and Clear All;
- the drag-and-drop area;
- the Analysis Mode selector;
- the Analyze Log button.
If Analyze Log is disabled, it is because no source is selected yet. Once you have at least one source, the button becomes available. Choose Different Input (shown after an analysis) returns you here to start over.
10. Summary
The Summary page is the top-level result of an analysis.
- Detected outcome — the overall result (for example, Packaging failed), with the mode, session, and evidence strength.
- Primary Diagnosis — the single highest-ranked eligible explanation supported by the evidence, with its severity, confidence, a plain-language explanation of why it was selected, and a first recommended action.
- Top candidates — the next most likely explanations.
- Related summaries & symptoms — messages that are consequences or final summaries rather than the original failure.
- Issue counts — compact counts by severity; selecting one opens Diagnostics filtered to it.
- Unknown issues — how many significant messages were not recognised.
- History & comparison — actions to save a snapshot, view history, or compare.
- What to do now — a short, ordered set of next steps.

A note on honesty: confidence and ranking are not probabilities. A high-confidence Primary Diagnosis is the best-supported explanation LogCheck found, not a statistical certainty. If custom rules contributed the primary diagnosis, the Summary says so.
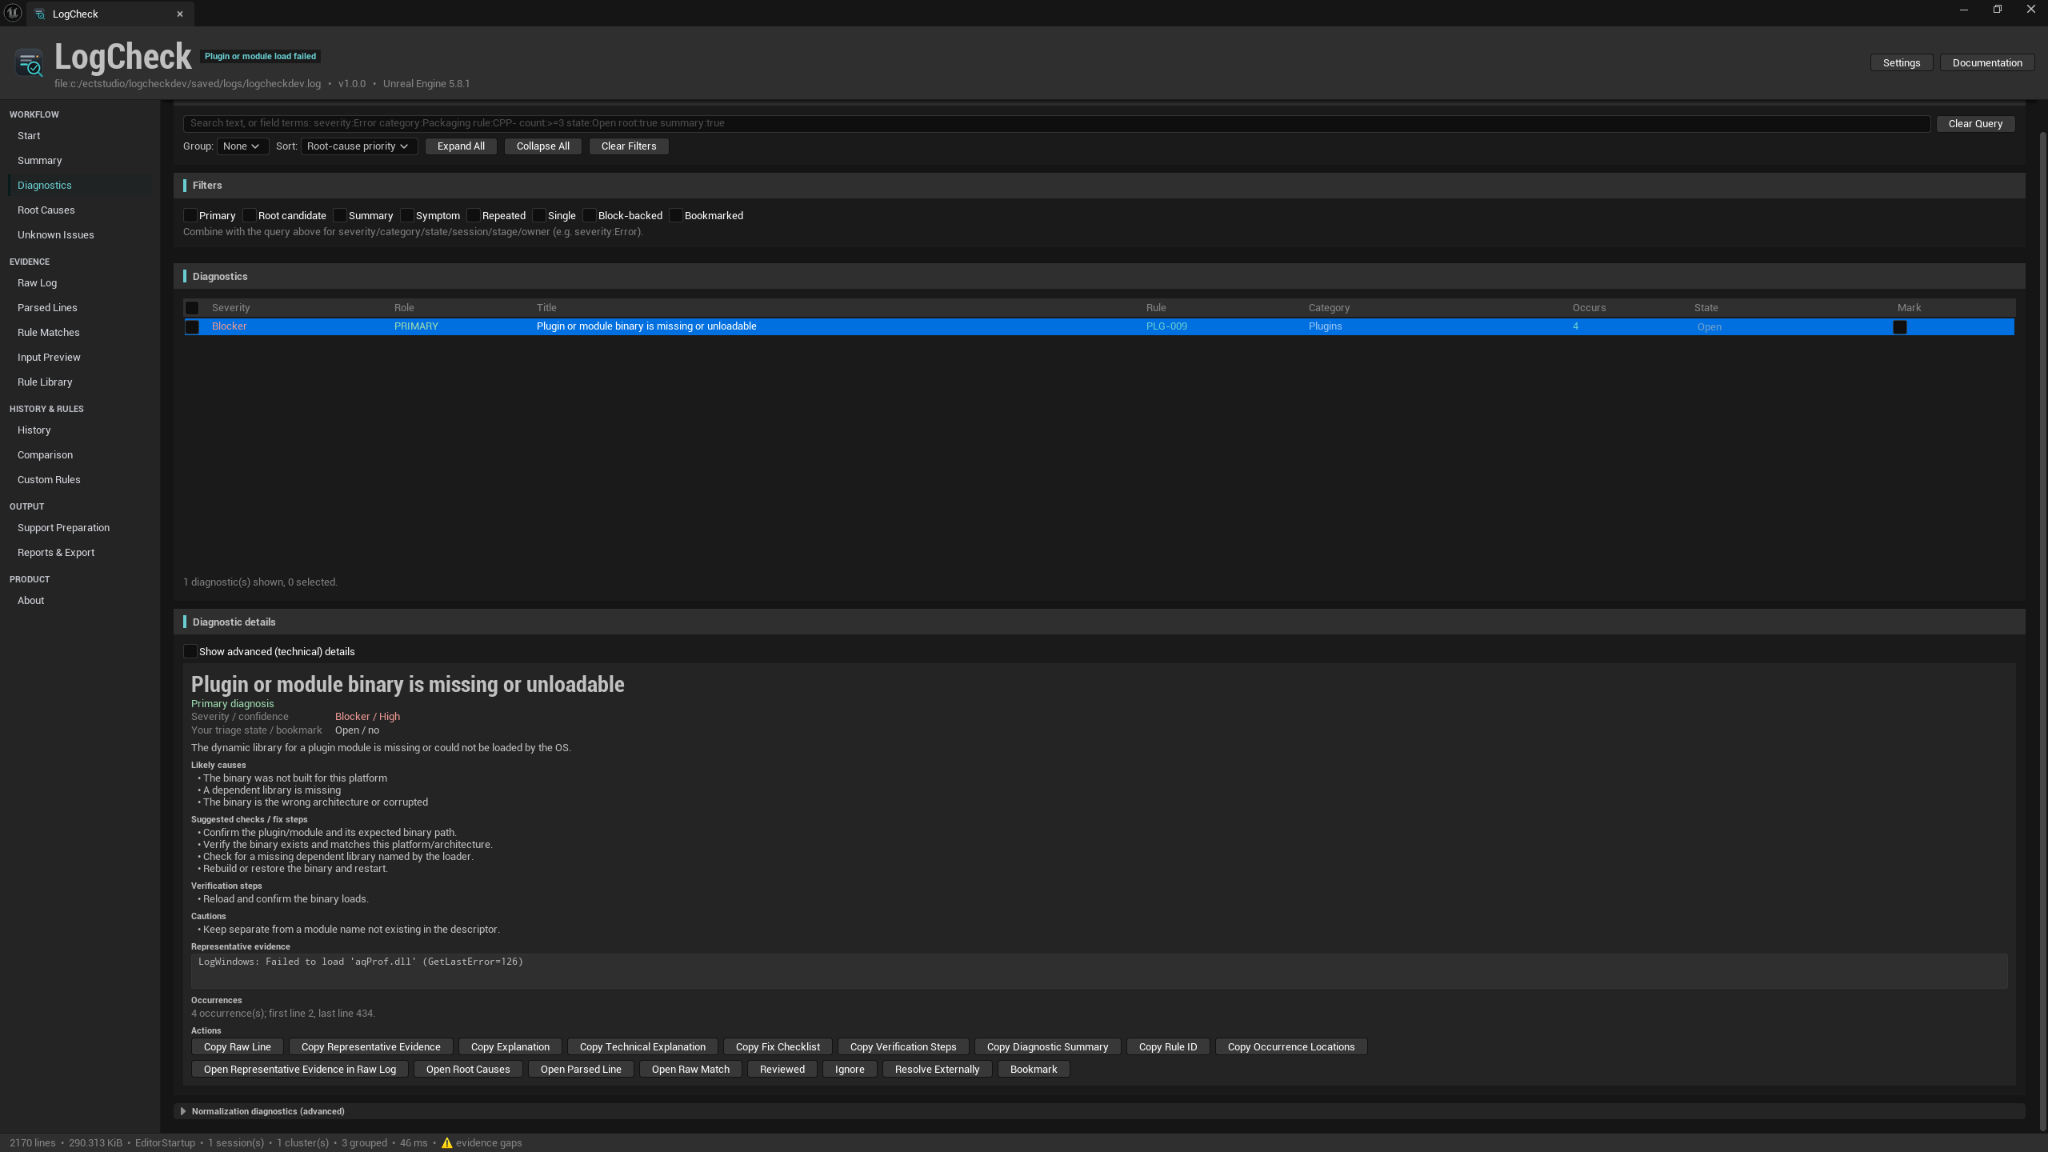
11. Diagnostics
The Diagnostics page is the full, searchable workspace of recognised issues.
- Search by free text, or use structured field terms.
- Group, Sort, Expand All / Collapse All, and Clear Filters.
- Filters: Primary, Root candidate, Summary, Symptom, Repeated, Single, Block-backed, Bookmarked.
- The table shows Severity, Role, Title, and originating Rule.
- Selecting a row opens Diagnostic details, with a Show advanced (technical) details toggle for beginner vs. advanced views.
Structured query terms let you narrow quickly. Some examples:
severity:Error
category:Packaging
rule:CPP-
count:>=3
state:Open
root:true
summary:true
You can combine terms with free text (for example, severity:Error include). Custom-
rule diagnostics show their origin so you can tell them apart from built-in results.
From a diagnostic you can jump straight to its evidence in Raw Log, Parsed Lines, or
Rule Matches.
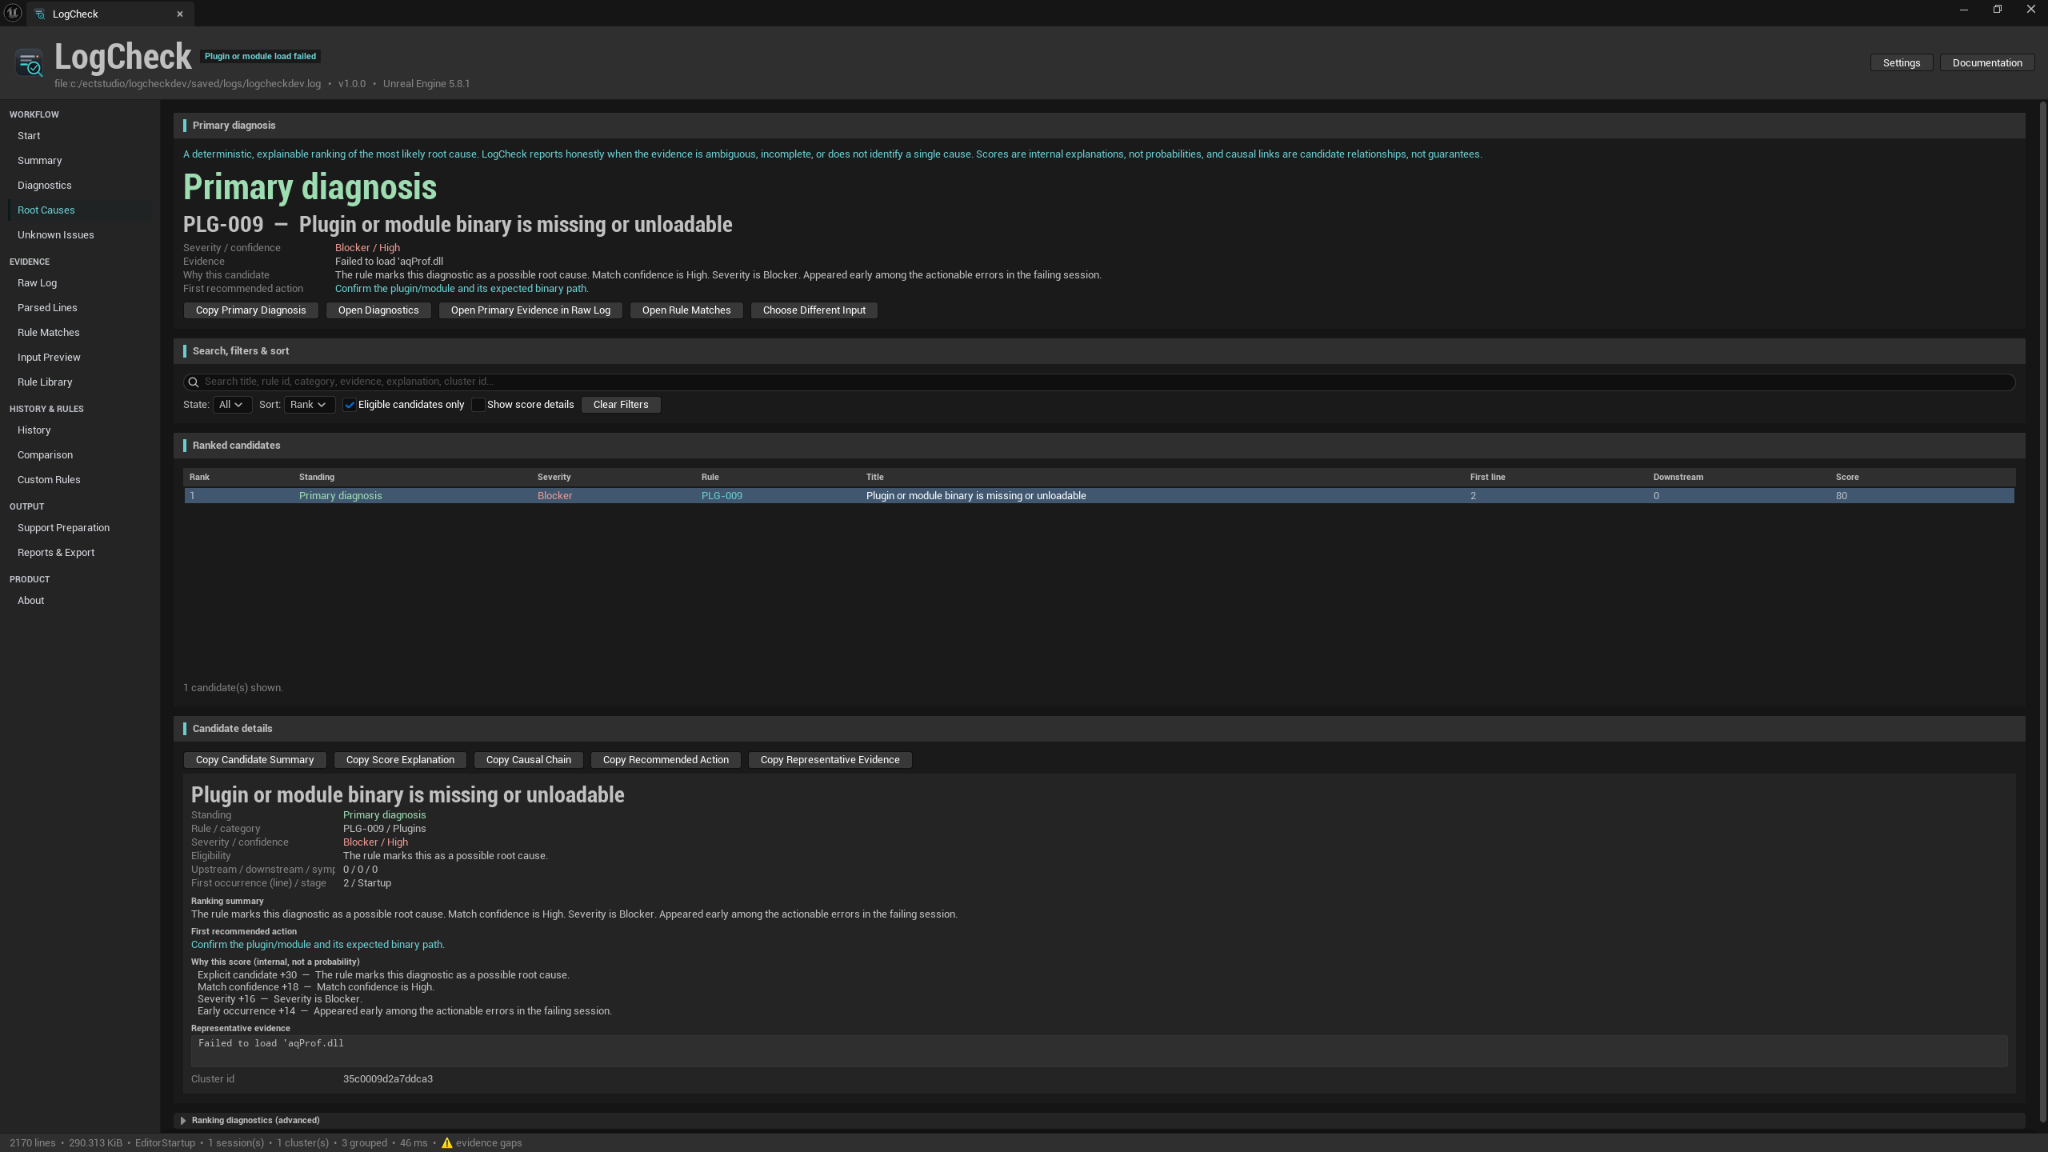
12. Root Causes
The Root Causes page explains the ranking behind the Primary Diagnosis.
- Primary cause — the selected explanation, presented prominently.
- Alternative candidates — other eligible explanations, ranked.
- Score factors — a compact, readable breakdown of what pushed a candidate up or down (for example, appearing early in the failing session, being in an actionable stage, or being owned by the project).
- Causal chains — links from a first failure to its downstream symptoms and final summaries.
Only eligible candidates are ranked; summaries, symptoms, and cascade messages are treated as consequences, not original causes. If custom ranking is active, it is labelled. Remember that scores are not probabilities and causal links are candidate relationships, not guarantees — the page keeps that wording visible without letting it dominate.
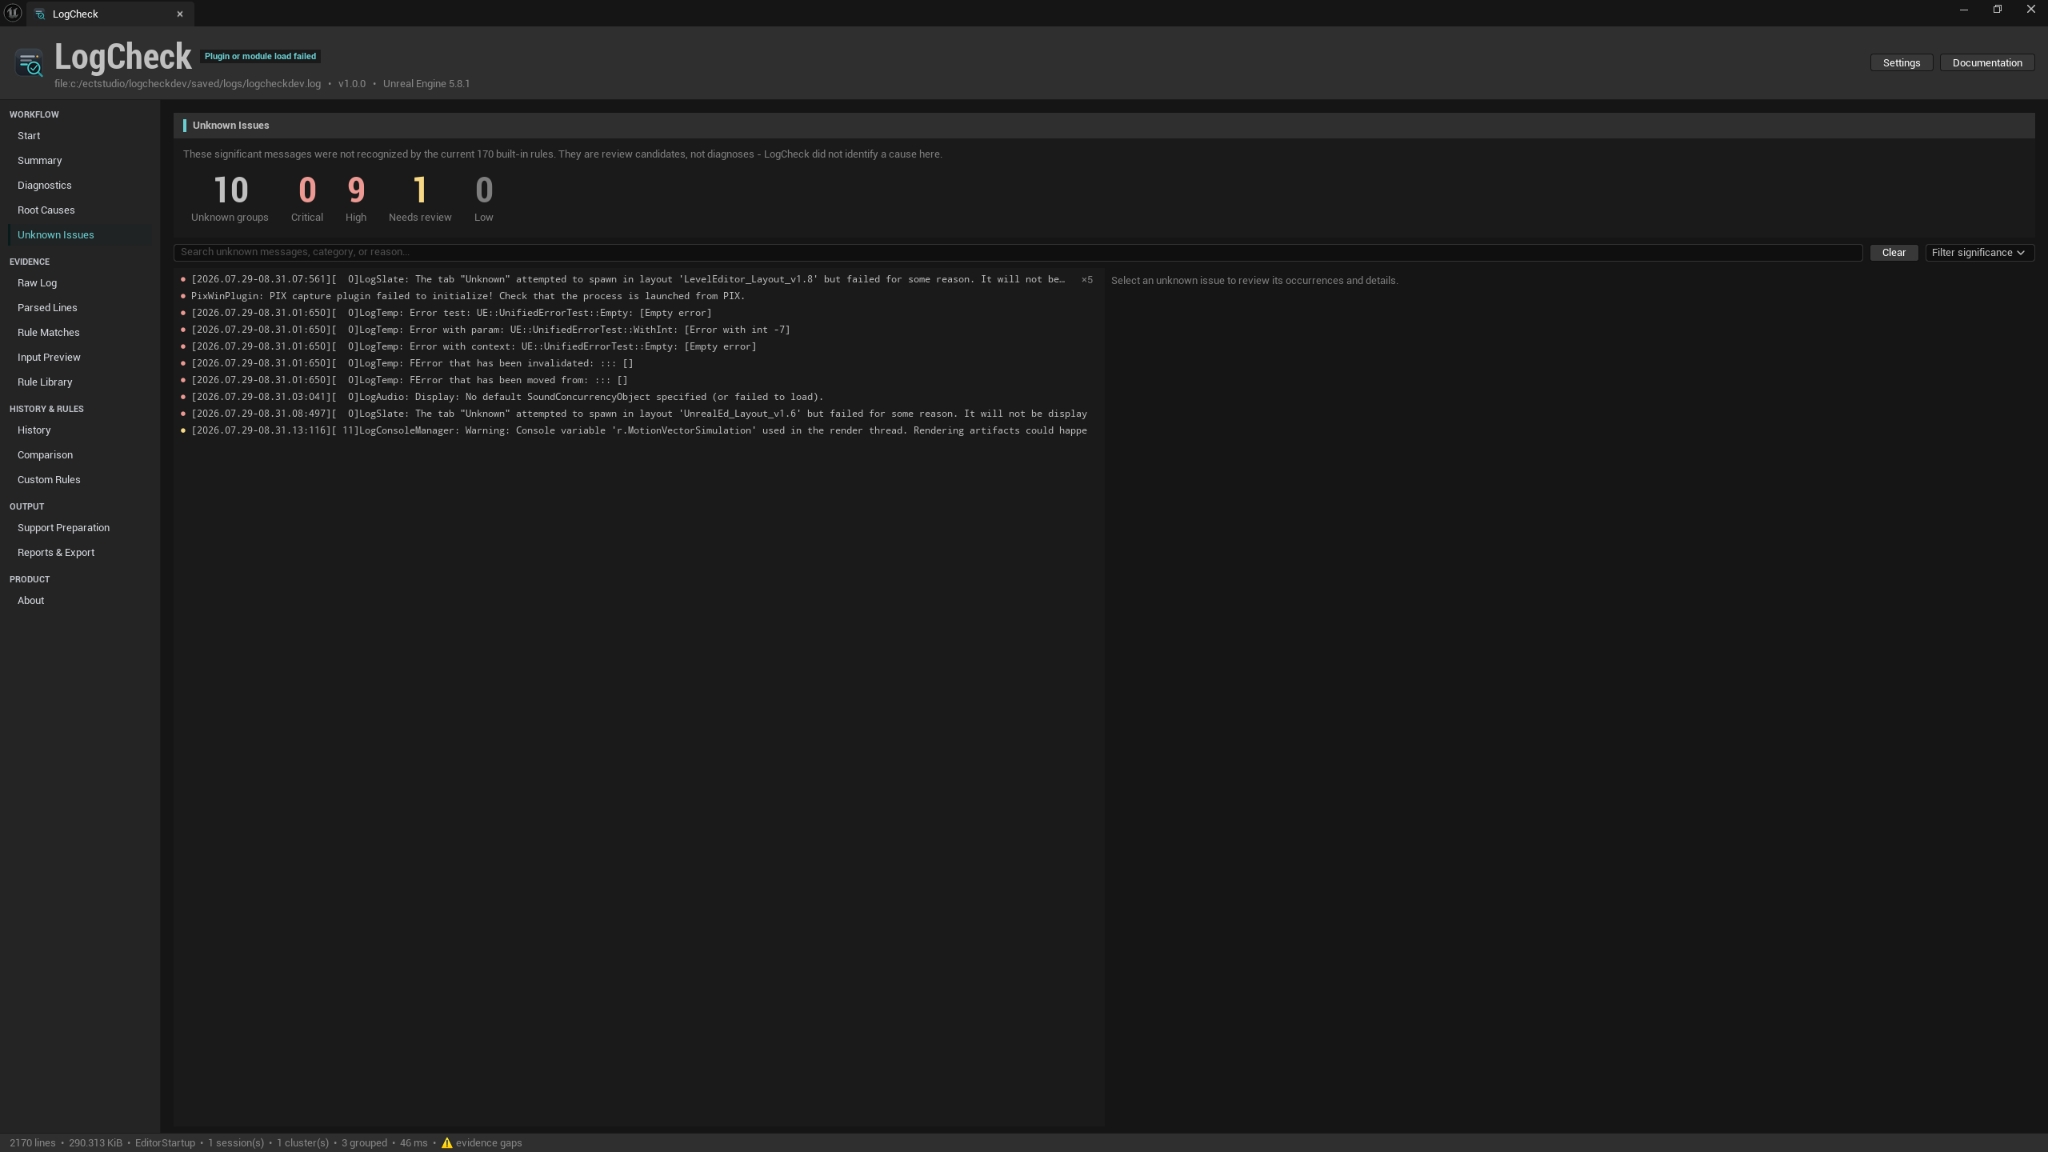
13. Unknown Issues
The Unknown Issues page collects significant messages that no built-in or enabled custom rule matched.
- Messages are grouped, with attention levels (for example, critical, high, needs review, low).
- Each group shows representative evidence and any variants.
- Nearby known context shows recognised diagnostics near the unmatched evidence.
- You can add a user classification, bookmark a group, and add notes.
- You can include a group in a support draft, and — where supported — create a draft custom rule from the evidence.
Unknown Issues are not confirmed diagnoses. They are a review queue: things worth a look that LogCheck could not explain. A user classification you add is clearly your own label, not a LogCheck diagnosis.
14. Raw Log
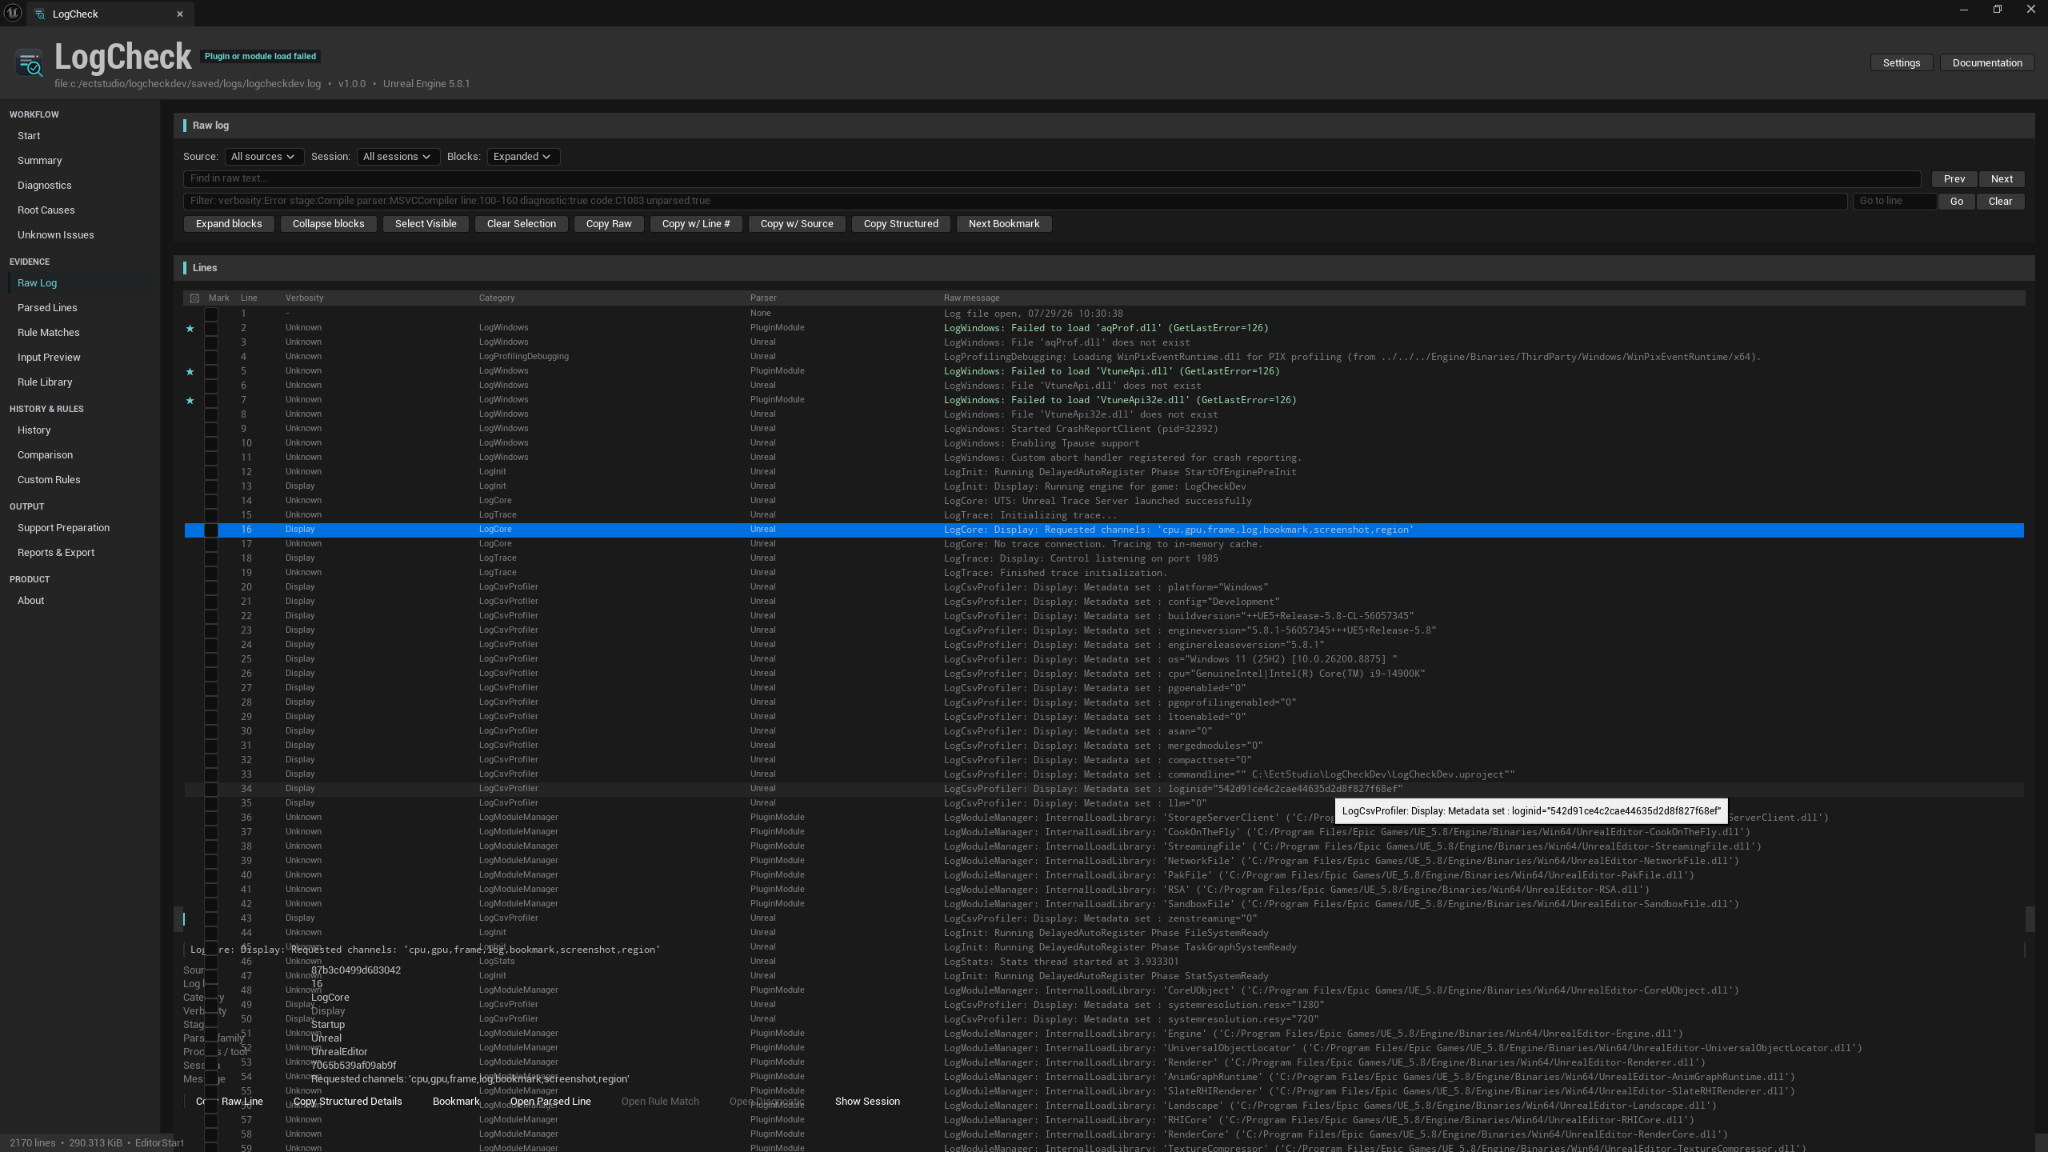
The Raw Log page is a fast, virtualized viewer of the complete source evidence.
- Source and Session selectors switch what you are viewing.
- Block mode groups multi-line evidence (such as a callstack) together.
- Search and structured filters narrow the view.
- Previous/Next and Go to line move you through matches and specific lines.
- Selection and copy let you pull exact evidence.
- Bookmarks and line markers flag known, custom, unknown, and selected-evidence lines.
Large logs stay virtualized — LogCheck renders only the visible rows, so a hundred-thousand-line log scrolls smoothly without building a widget per line. From a diagnostic elsewhere in the app, Open Primary Evidence in Raw Log brings you to the exact line.
15. History
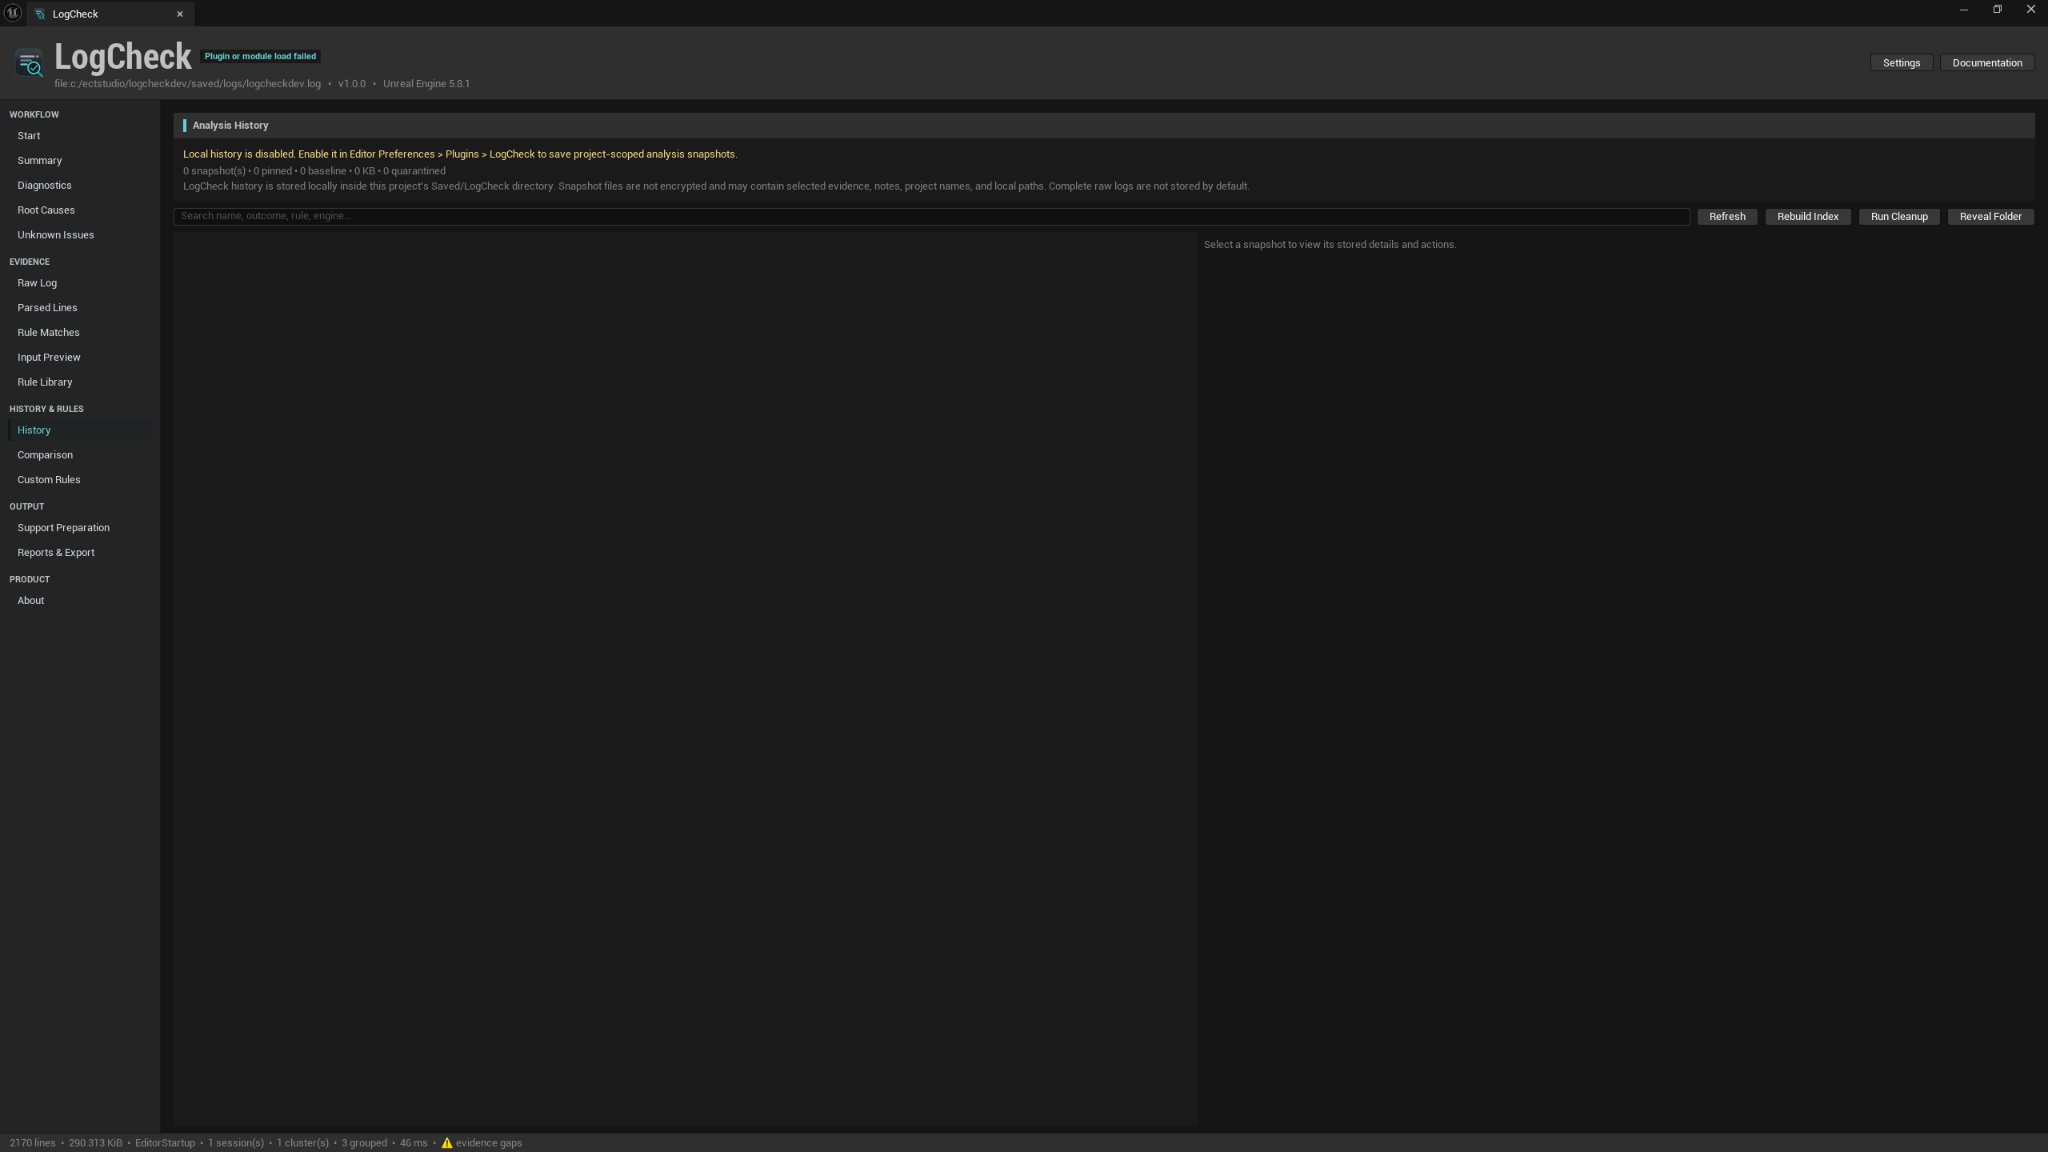
LogCheck can keep a local, project-scoped history of analyses.
- History is off by default. Enable it in Settings (or via the History page's action where available).
- Snapshots are stored under your project's
Saved/LogCheckarea. They are local and not encrypted. - You can save snapshots manually, and optionally save completed analyses automatically.
- A snapshot stores analysis metadata and bounded evidence excerpts — it does not store your complete Raw Log.
- You can pin, rename, and tag snapshots, apply retention limits, rebuild the index, and delete snapshots.
- If a snapshot file is corrupted, it is moved to a quarantine area rather than breaking the history list.
Because history is local and unencrypted, treat the Saved/LogCheck folder like any
other local project data.
16. Baselines and Comparison
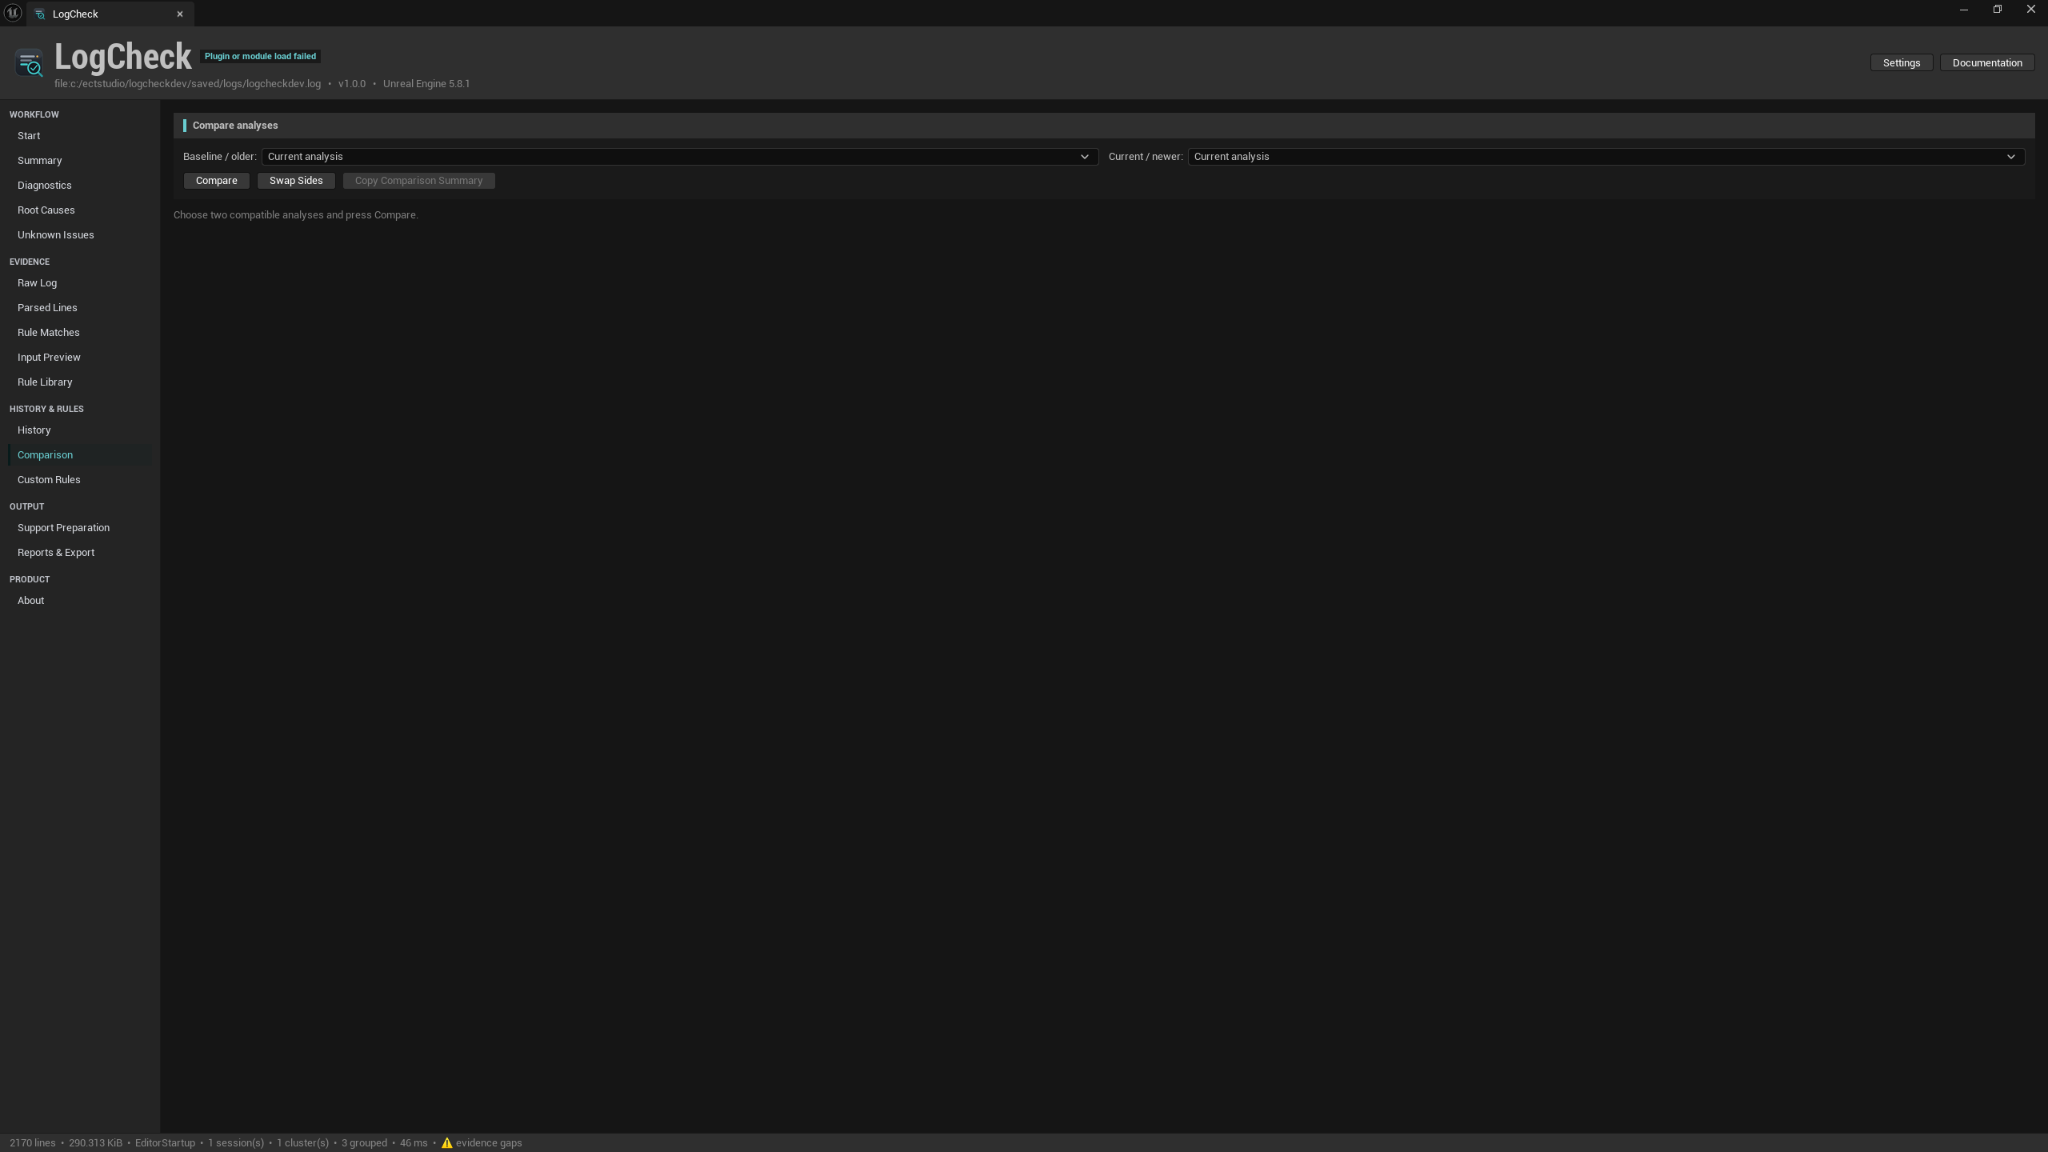
The Comparison page shows what changed between two analyses.
- Set a Baseline from a snapshot, then compare Current vs Baseline, or compare Snapshot vs Snapshot.
- LogCheck first checks compatibility (comparing unrelated logs is called out).
- Differences are grouped as New, Resolved, Persisting, Changed, Newly Recognized, and Not Evaluated, with unknown and state changes shown too.
One important subtlety: if a rule was removed or disabled between two analyses, a diagnostic it used to produce will show as Not Evaluated, not Resolved. A missing diagnostic does not by itself mean the underlying problem was fixed.
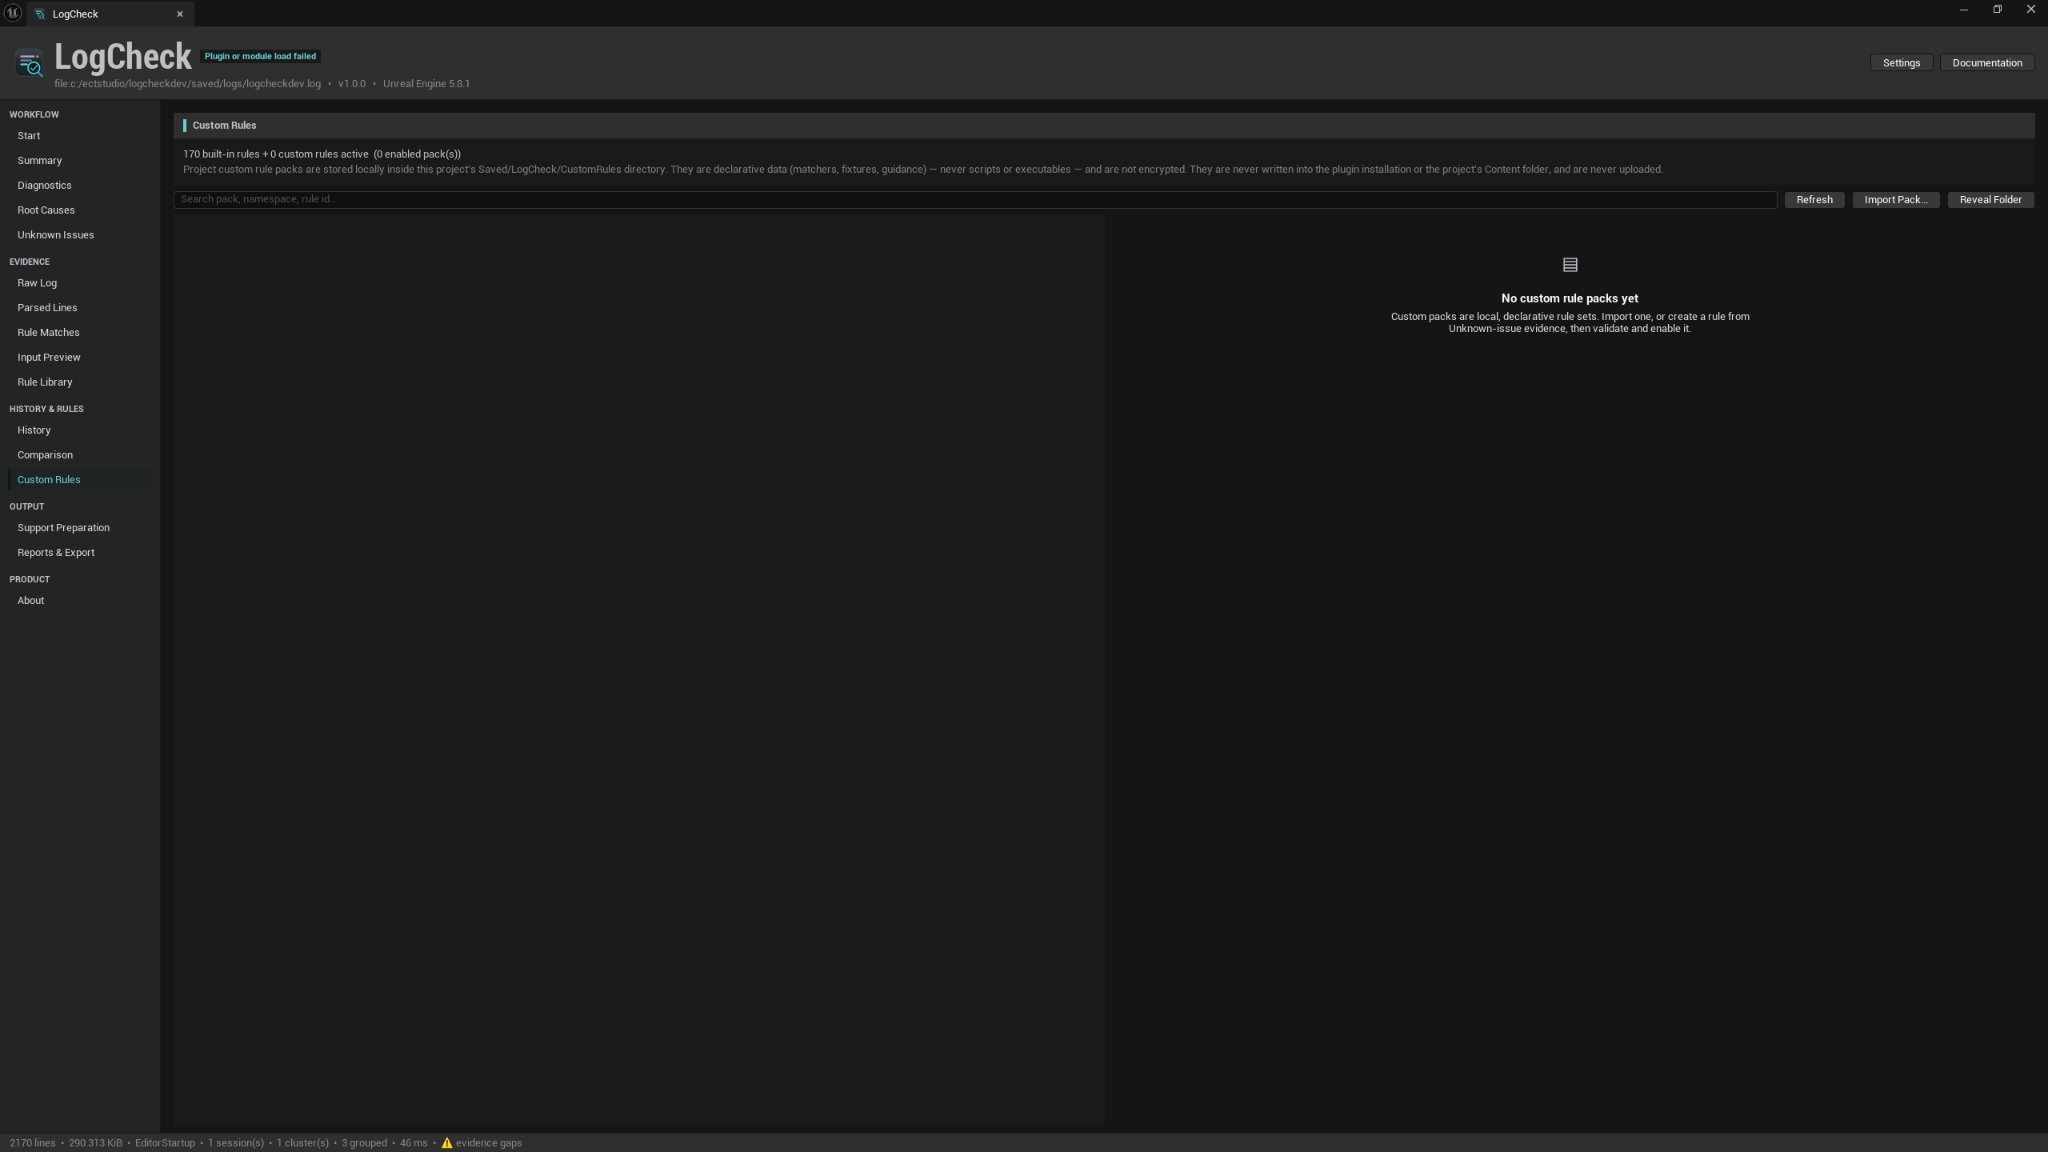
17. Custom Rules
Custom rules let you extend LogCheck with your own diagnostics. They are declarative and data-only — there is no scripting and no executable extension.
Packs and scope. Rules live in packs. A pack is project-scoped or user- scoped, and is enabled per project. Rule IDs are namespaced so they never collide with built-in IDs.
Creating rules. From the Custom Rules page you can create a pack and add rules. A rule has:
- a matcher (substring, SafeRegex, structured field conditions, and more);
- applicability (engine range, mode, parser family, and similar constraints);
- optional captures, normalization, and relationships;
- fixtures — a positive example that must match, a negative example that must not, and optionally a near-miss to guard the boundary.
Validation. LogCheck validates a pack before you rely on it: schema, matcher safety, fixture results, and conflicts. SafeRegex rejects patterns that are unsafe or too expensive. An impact preview shows how a rule would affect a real analysis.
Activation. A new or imported pack is disabled until you review and enable it. Enabling a pack for diagnostics is separate from enabling it for ranking — custom rules only influence the Primary Diagnosis if you explicitly activate custom ranking.
Import/export and safety. You can export a pack as a .lcrules.json file and
import packs from others. Imported packs arrive disabled and unreviewed — treat
them like any third-party content and read them before enabling. LogCheck keeps
backups, detects conflicts, and quarantines invalid packs. Built-in rules
are read-only and protected; a custom rule is never presented as authored or verified
by ECal Studios.
18. Parsed Lines
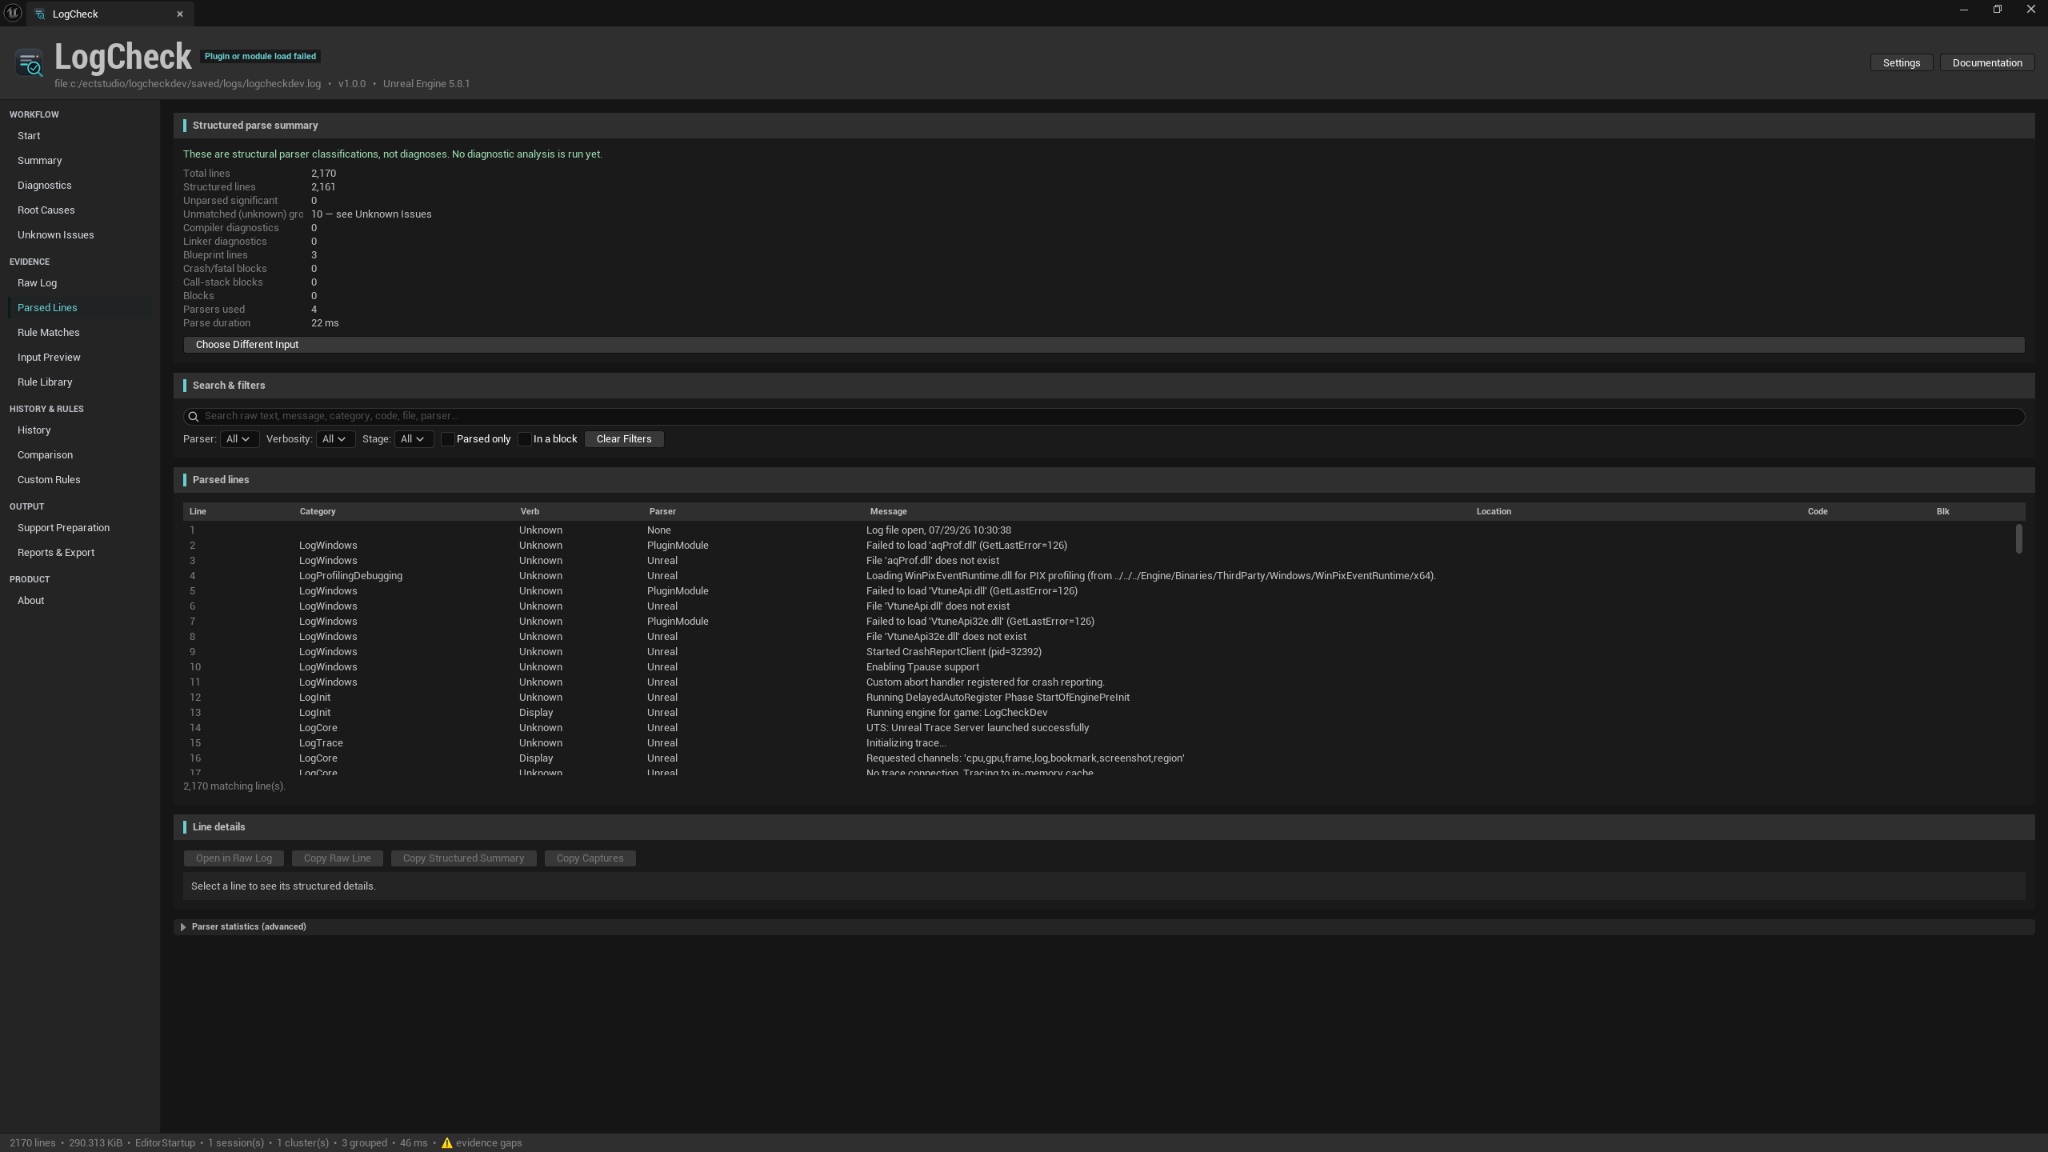
The Parsed Lines page shows the structural interpretation of your log: each line's category, verbosity, parser family, captures, and its membership in blocks. You can jump from a parsed line to its place in Raw Log.
Parsed Lines are structural interpretations of the text, not diagnoses. They show how LogCheck read the log before any rules were applied.
19. Rule Matches
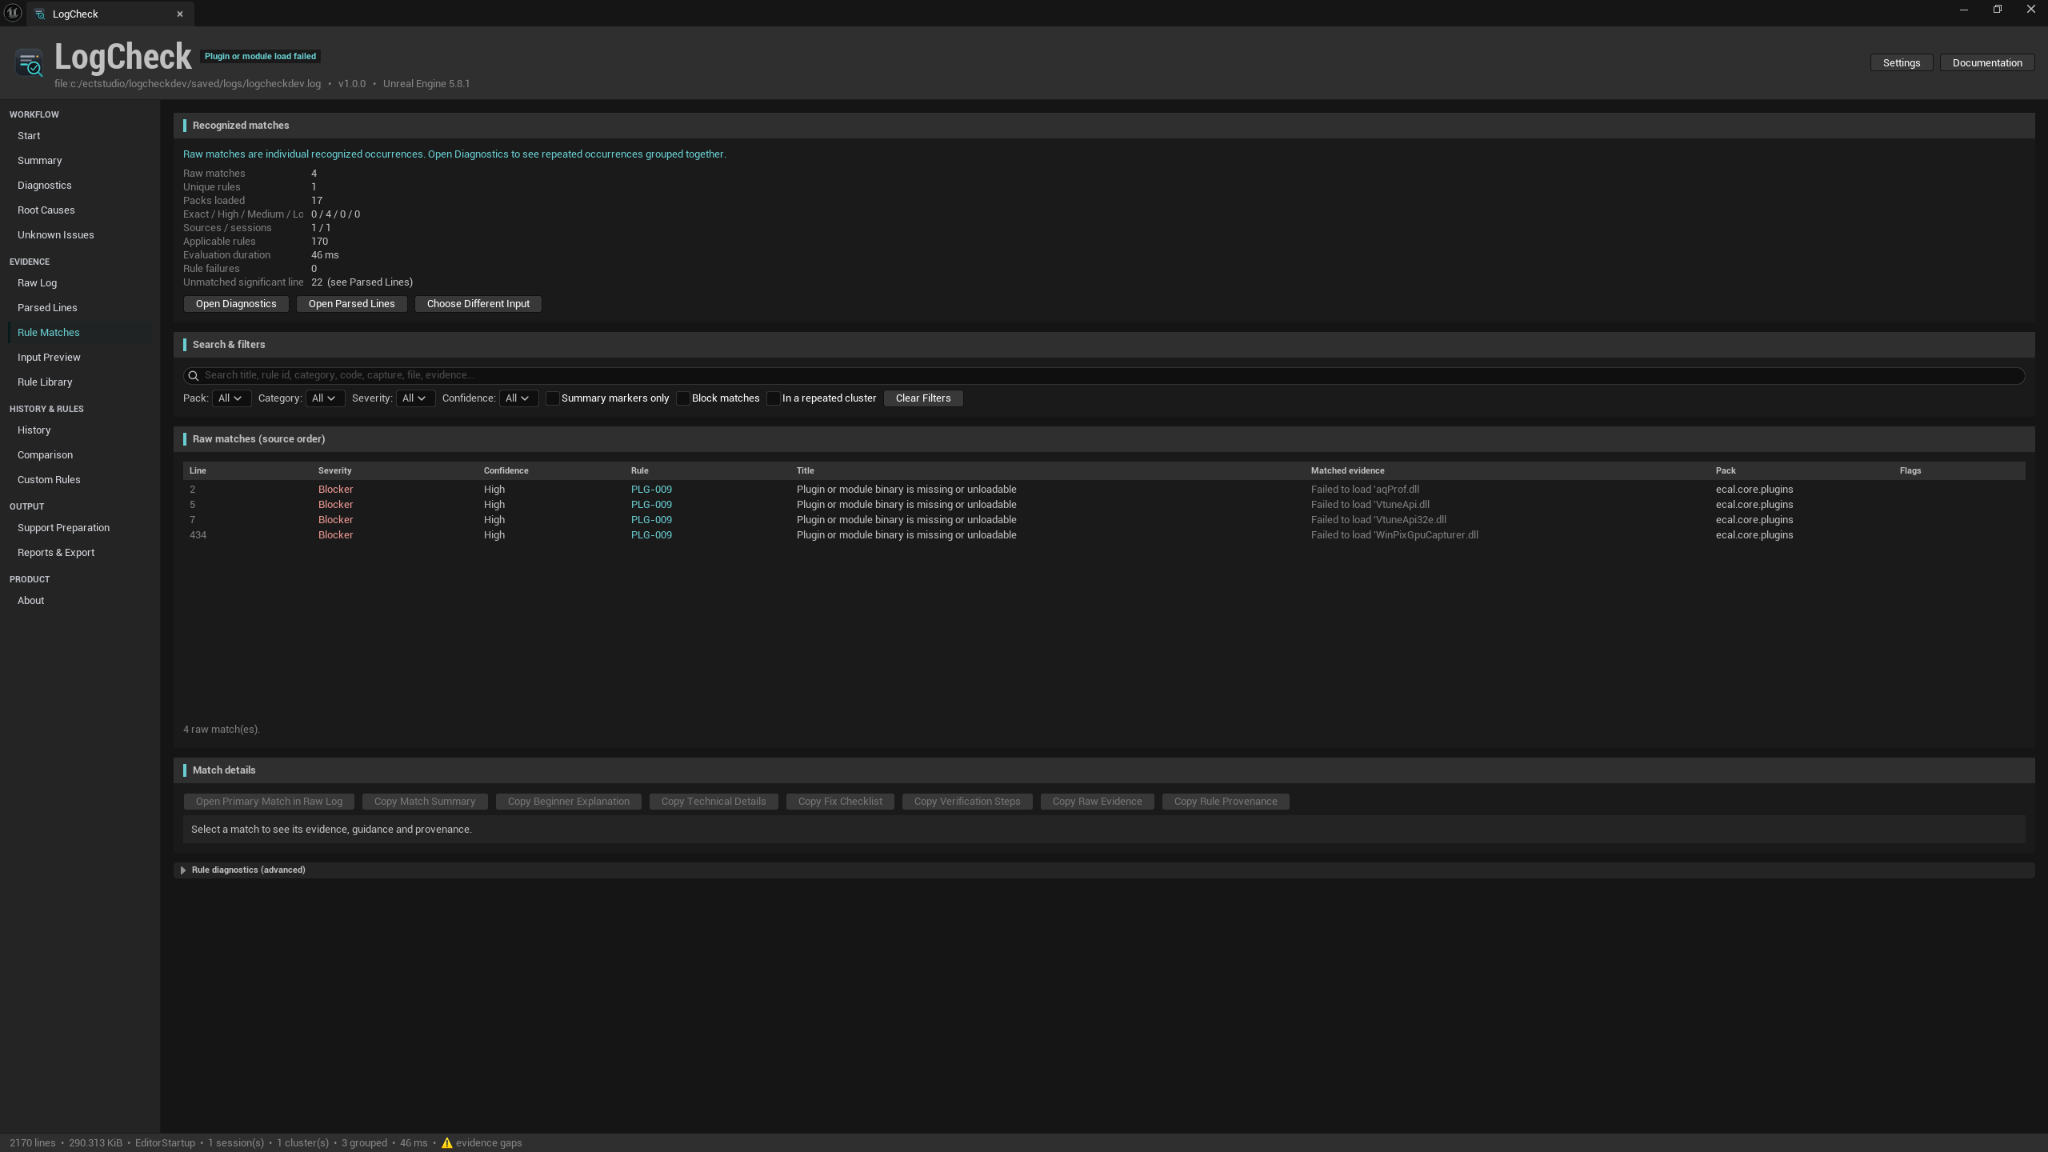
The Rule Matches page lists individual raw recognised occurrences — each place a rule matched, before grouping. Each match shows its rule origin (built-in or custom), evidence, captures, and context. Repeated matches are grouped into a single diagnostic on the Diagnostics page; from a match you can navigate to that grouped diagnostic.
20. Input Preview
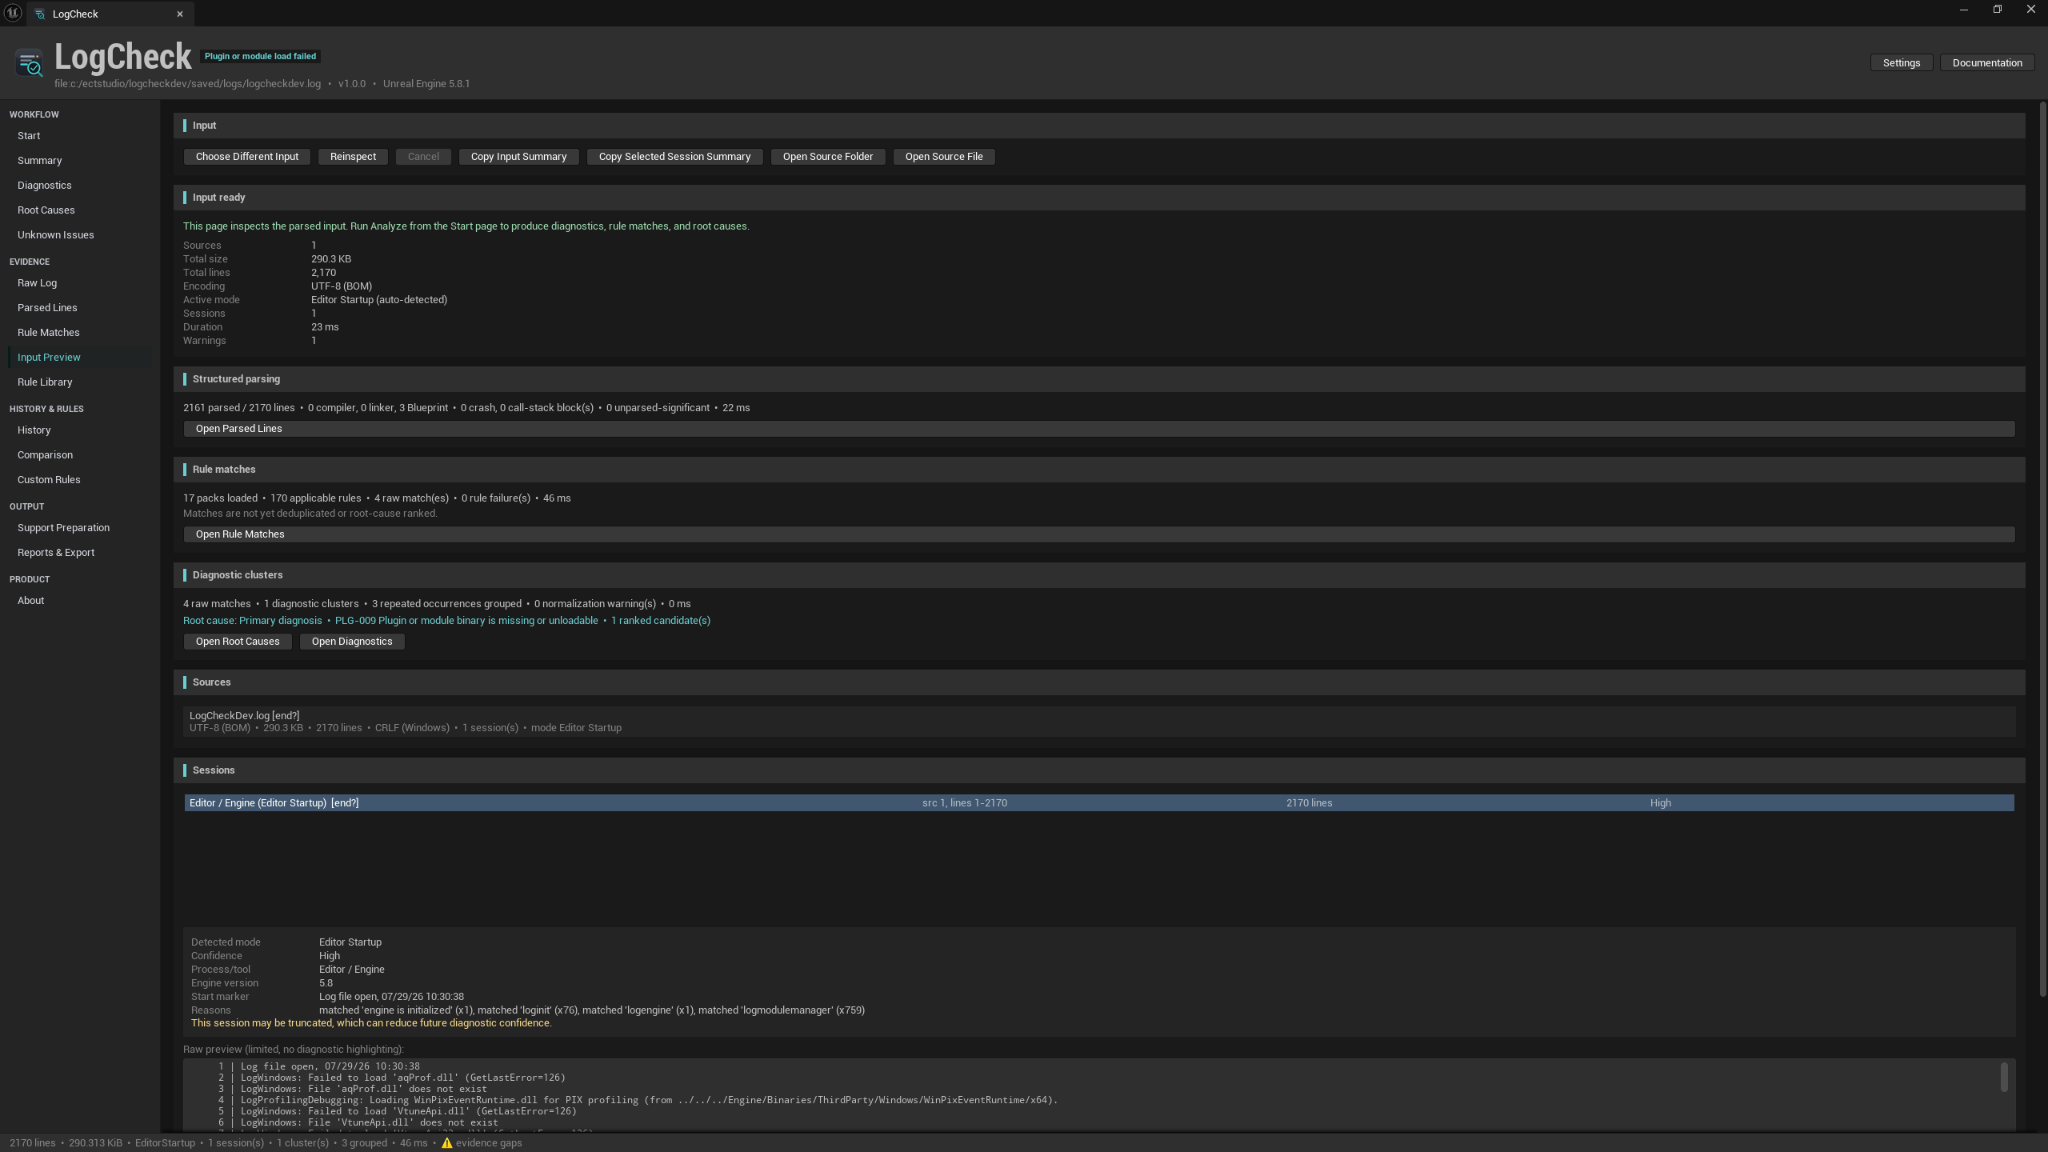
The Input Preview page summarises what LogCheck detected about your input before you dig into diagnostics: source metadata, encoding, sessions, Analysis Mode, and summaries of parsing, rule matches, and diagnostic clusters. Choose Different Input returns you to Start. It is a good place to confirm LogCheck read your log the way you expected.
21. Rule Library
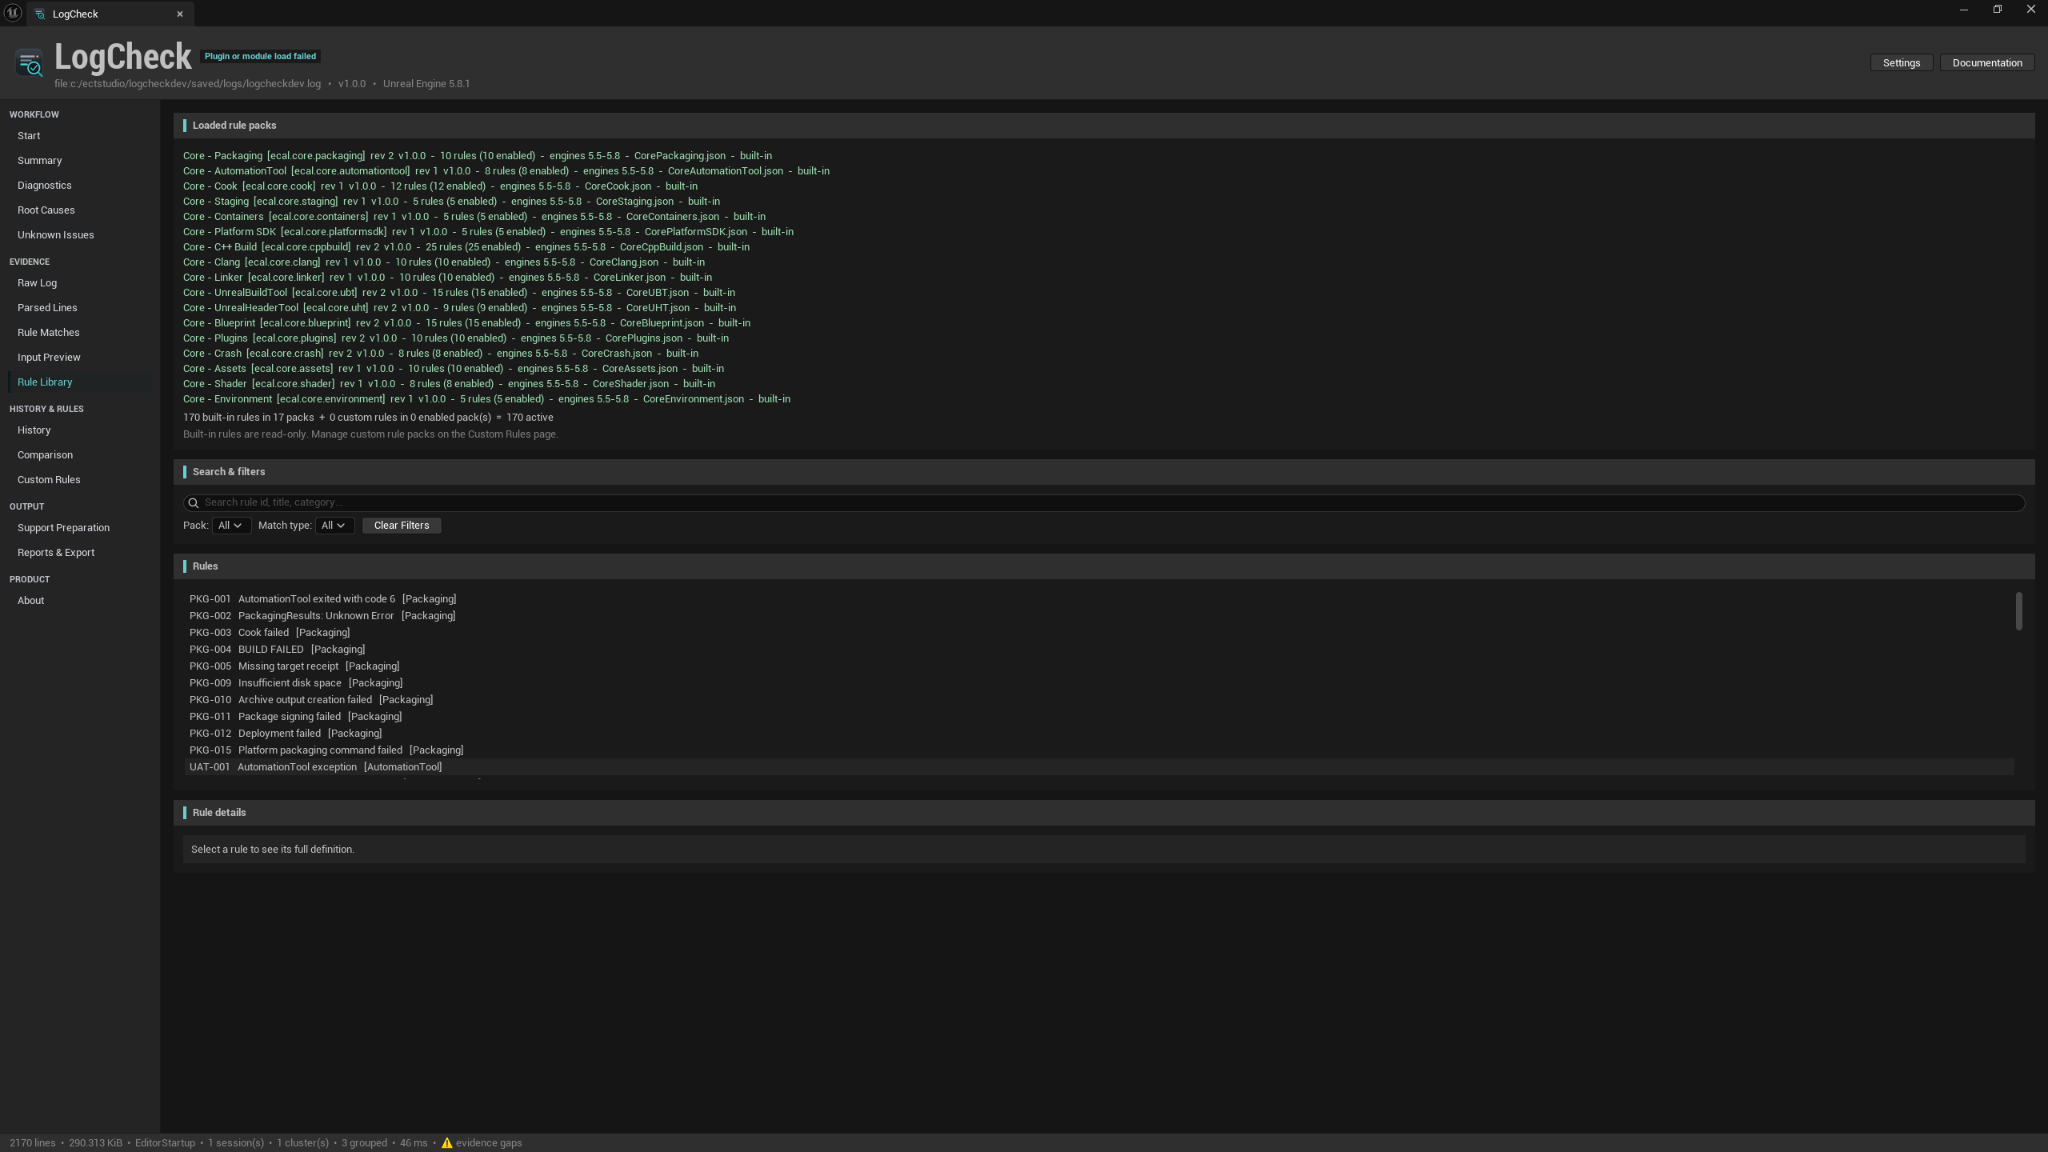
The Rule Library page is the catalogue of installed rules.
- It reports 170 built-in rules across 17 built-in packs, with built-in and custom counts shown separately.
- You can filter by pack and search rules.
- Selecting a rule shows its details.
- Built-in rules are read-only; custom entries open in the Custom Rules page.
22. Support Preparation
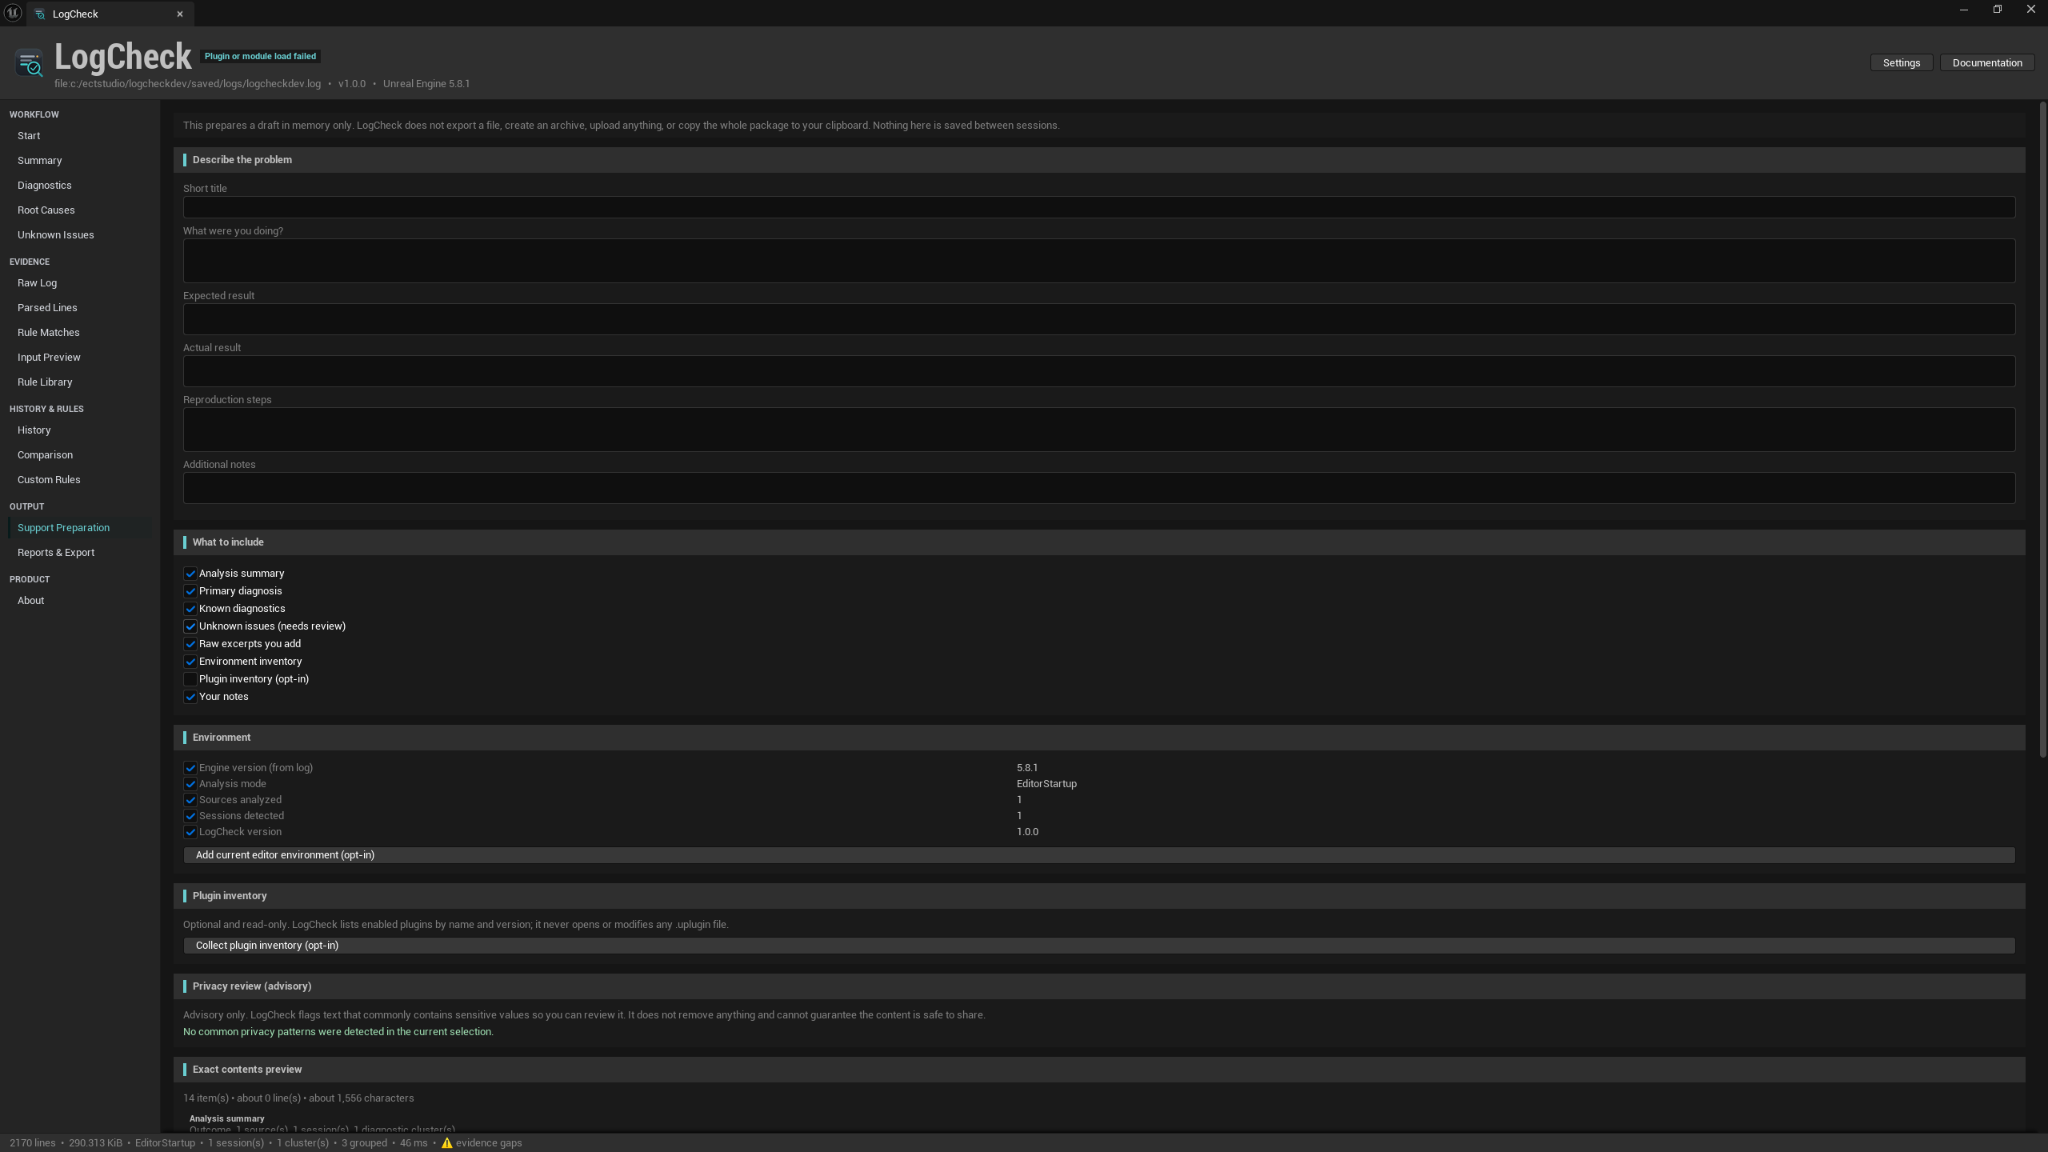
Support Preparation helps you assemble the content for a support request. The workflow is:
- Describe the problem in your own words.
- Select known diagnostics to include.
- Select Unknown Issues to include.
- Add excerpts of evidence.
- Review environment information (engine, platform, and similar).
- Opt into a selected plugin inventory if you want to include it.
- Review privacy warnings.
- Save the draft if you want to keep working on it.
- Continue to Reports & Export to produce the actual file.
Support Preparation does not upload anything. It prepares and organises the content; the final file is created on the Reports & Export page. "Prepared" does not mean "guaranteed safe to share" — always review the exported content yourself.
23. Reports and Export
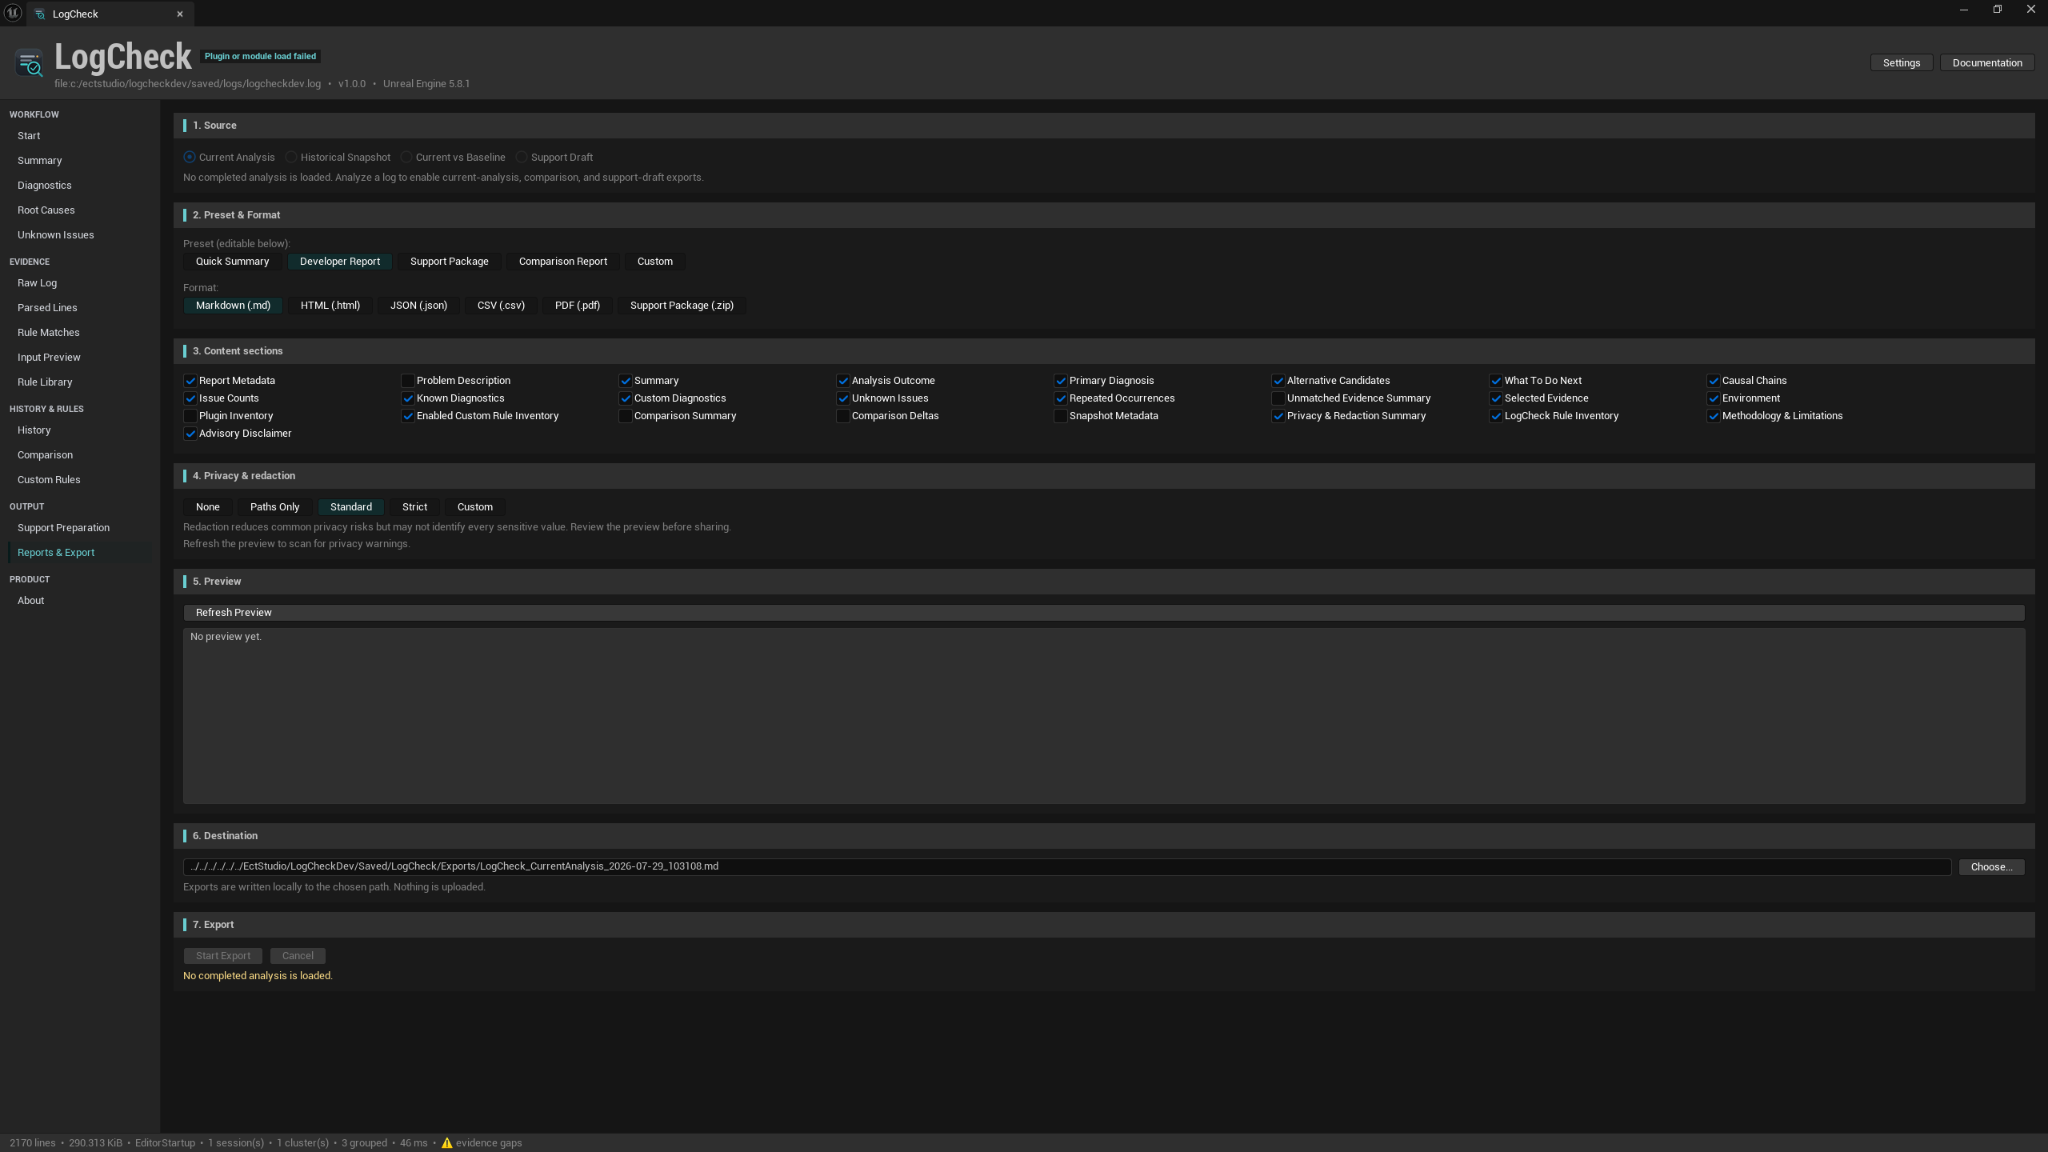
The Reports & Export page writes report and support files locally.
Formats: Markdown, standalone HTML, JSON, CSV, PDF, and a support-package ZIP.
What you control:
- Source type — Current Analysis, Historical Snapshot, Comparison, or Support Draft.
- Preset and content selection — which sections to include.
- Privacy profile — the Redaction Profile applied to the export.
- Preview — see the content before writing it.
- Destination — where the file is written.
After an export, LogCheck reports a checksum and offers Open File, Open Folder, and Copy Path. Exports are atomic (written to a temporary file, then moved into place) and can be cancelled. Nothing is uploaded — every file is written to the location you choose.
24. Privacy Review and Redaction
Before you export, LogCheck can redact sensitive values using deterministic Redaction Profiles:
| Profile | Effect |
|---|---|
| None | No redaction. |
| Paths Only | Redact filesystem paths. |
| Standard | Redact common sensitive values (paths, usernames, and similar). |
| Strict | Redact the broadest set. |
| Custom | Your chosen combination. |
Redaction replaces values with deterministic tokens, so the same value gets the same token throughout a single export:
<USER_1>
<PROJECT_ROOT>
<PLUGIN_1>
<IP_1>
Key points:
- Redaction is applied to the exported copy. Your source analysis is not modified.
- LogCheck shows residual warnings when it detects values that may still be sensitive. You can Keep Original for a specific value or provide a manual exact replacement.
- Redaction is advisory. LogCheck does not guarantee anonymization, and it makes no regulatory (for example, GDPR) certification. Always review an export before sharing it.
25. Settings
Open settings from the header's Settings button (Editor Preferences → Plugins → LogCheck). Settings are grouped by subsystem:
- Analysis — context line counts and analysis limits.
- Unknown Issues — how unmatched evidence is grouped and surfaced.
- History — enable local history, automatic snapshots, retention, and evidence inclusion.
- Custom Rules — custom-pack behaviour.
- Reports — export defaults.
- Privacy — default redaction behaviour (paths, machine name, and project path are redacted by default; project name is not).
- UI — interface preferences.
Only current, applicable settings are shown.
26. Common Workflows
Packaging failure. Load the latest AutomationTool log, Analyze, read the outcome and Primary Diagnosis, open the primary evidence in Raw Log, then export a report for your teammate.
C++ build failure. Paste or load the build log, confirm the C++ Build mode, and let Root Causes rank the first actionable compiler/linker error above its downstream symptoms.
Blueprint compile failure. Load the editor log, Analyze, and use Diagnostics filters to focus on Blueprint-category issues.
Plugin/module load failure. Load the editor startup log and check the Primary Diagnosis for the failing module, then follow the recommended action.
Unknown issue review. After an analysis, open Unknown Issues, classify the important groups, and turn a recurring one into a draft custom rule.
Compare before/after a fix. Save a snapshot, apply your fix, run a new analysis, then use Comparison to confirm the issue moved from Persisting to Resolved (and that nothing New appeared).
Prepare a support package. Use Support Preparation to select diagnostics, evidence, and environment info, review privacy warnings, then export a support ZIP on the Reports & Export page.
Create a custom rule from unknown evidence. From an Unknown Issue, start a draft rule, add positive/negative fixtures, validate, and enable the pack for your project.
27. Troubleshooting
The LogCheck menu is missing. The plugin did not load. Check Edit → Plugins (category ECal Studios) is enabled, confirm the modules compiled, and restart the editor.
The plugin fails to compile. Ensure your project is a C++ project and your Unreal
C++ toolchain is installed. Delete the plugin's Binaries/Intermediate and rebuild.
Do not reuse binaries from another engine version.
No log source is found. For "Load Latest Project Log" the editor must have written a log. Otherwise use Load Log File, Paste Log Text, or the synthetic sample.
Recent logs are empty. Your project may not have recent logs in the expected location. Load a file directly instead.
Analysis produces no diagnosis. The log may contain no recognised failure, or the failure may not have a built-in rule. Check the outcome, review Unknown Issues, and consider a custom rule. (If you are on a UE 5.8 patch release, make sure you are running LogCheck v1.0.0, which recognises all 5.8.x patch versions.)
Unknown Issues are present. That is expected — they are significant messages no rule matched. Review and classify them; they do not change the diagnosis above.
History is disabled. History is off by default. Enable local history in Settings.
Comparison is unavailable. You need two compatible analyses (a baseline plus a current analysis, or two snapshots). Save a snapshot first.
A custom pack will not enable. It likely failed validation. Open the pack, read the validation messages, fix the rule or its fixtures, and re-validate.
SafeRegex validation fails. Your pattern was rejected as unsafe or too expensive. Simplify it — avoid unbounded nested quantifiers and catastrophic backtracking; prefer a literal anchor plus a bounded pattern.
Export is disabled. Export needs a valid source (an analysis, snapshot, comparison, or support draft). Run an analysis or select a source first.
Destination permission error. LogCheck could not write to the chosen folder. Pick a writable location.
PDF or ZIP export fails. Confirm the destination is writable and has space, then retry. Exports are atomic, so a failed export does not leave a partial file in place.
Privacy warnings remain. Residual warnings mean values may still be sensitive. Choose a stronger profile, provide a manual replacement, or Keep Original deliberately — and review the export before sharing.
The Documentation button does nothing. It opens the documentation in your browser or
the local docs, depending on availability. Confirm you have a default browser set, or
open the Docs folder manually.
For every issue: identify the likely reason, make a safe check, and take the next action. Not every problem is resolved by a single step.
28. Privacy, Safety, and Limitations
- LogCheck runs locally: no network, no telemetry, no upload, no accounts.
- It never modifies your project — no code, Blueprint, asset, plugin, or config changes — and never applies fixes automatically.
- A Primary Diagnosis is the highest-ranked eligible explanation supported by the evidence; it is advisory, not guaranteed.
- Ranking scores are not probabilities, and causal links are candidate relationships, not guarantees.
- Redaction is advisory — not guaranteed anonymization.
- Custom rules are a trust boundary — imported packs are disabled until you review them.
- Coverage is not exhaustive — not every log message has a built-in rule.
- History stores bounded evidence, not your complete Raw Log, and is local and unencrypted.
29. Getting Support
If you need help, contact ECal Studios:
[email protected]
https://www.ecalstudios.com
To make support effective, include:
- your Unreal Engine version;
- your LogCheck version;
- the Analysis Mode used;
- a report or support package exported from LogCheck (reviewed for privacy first);
- steps to reproduce the problem;
- whether any custom rules were active.
Please do not send complete private logs by default — export a redacted report or support package instead, and review it before sharing.
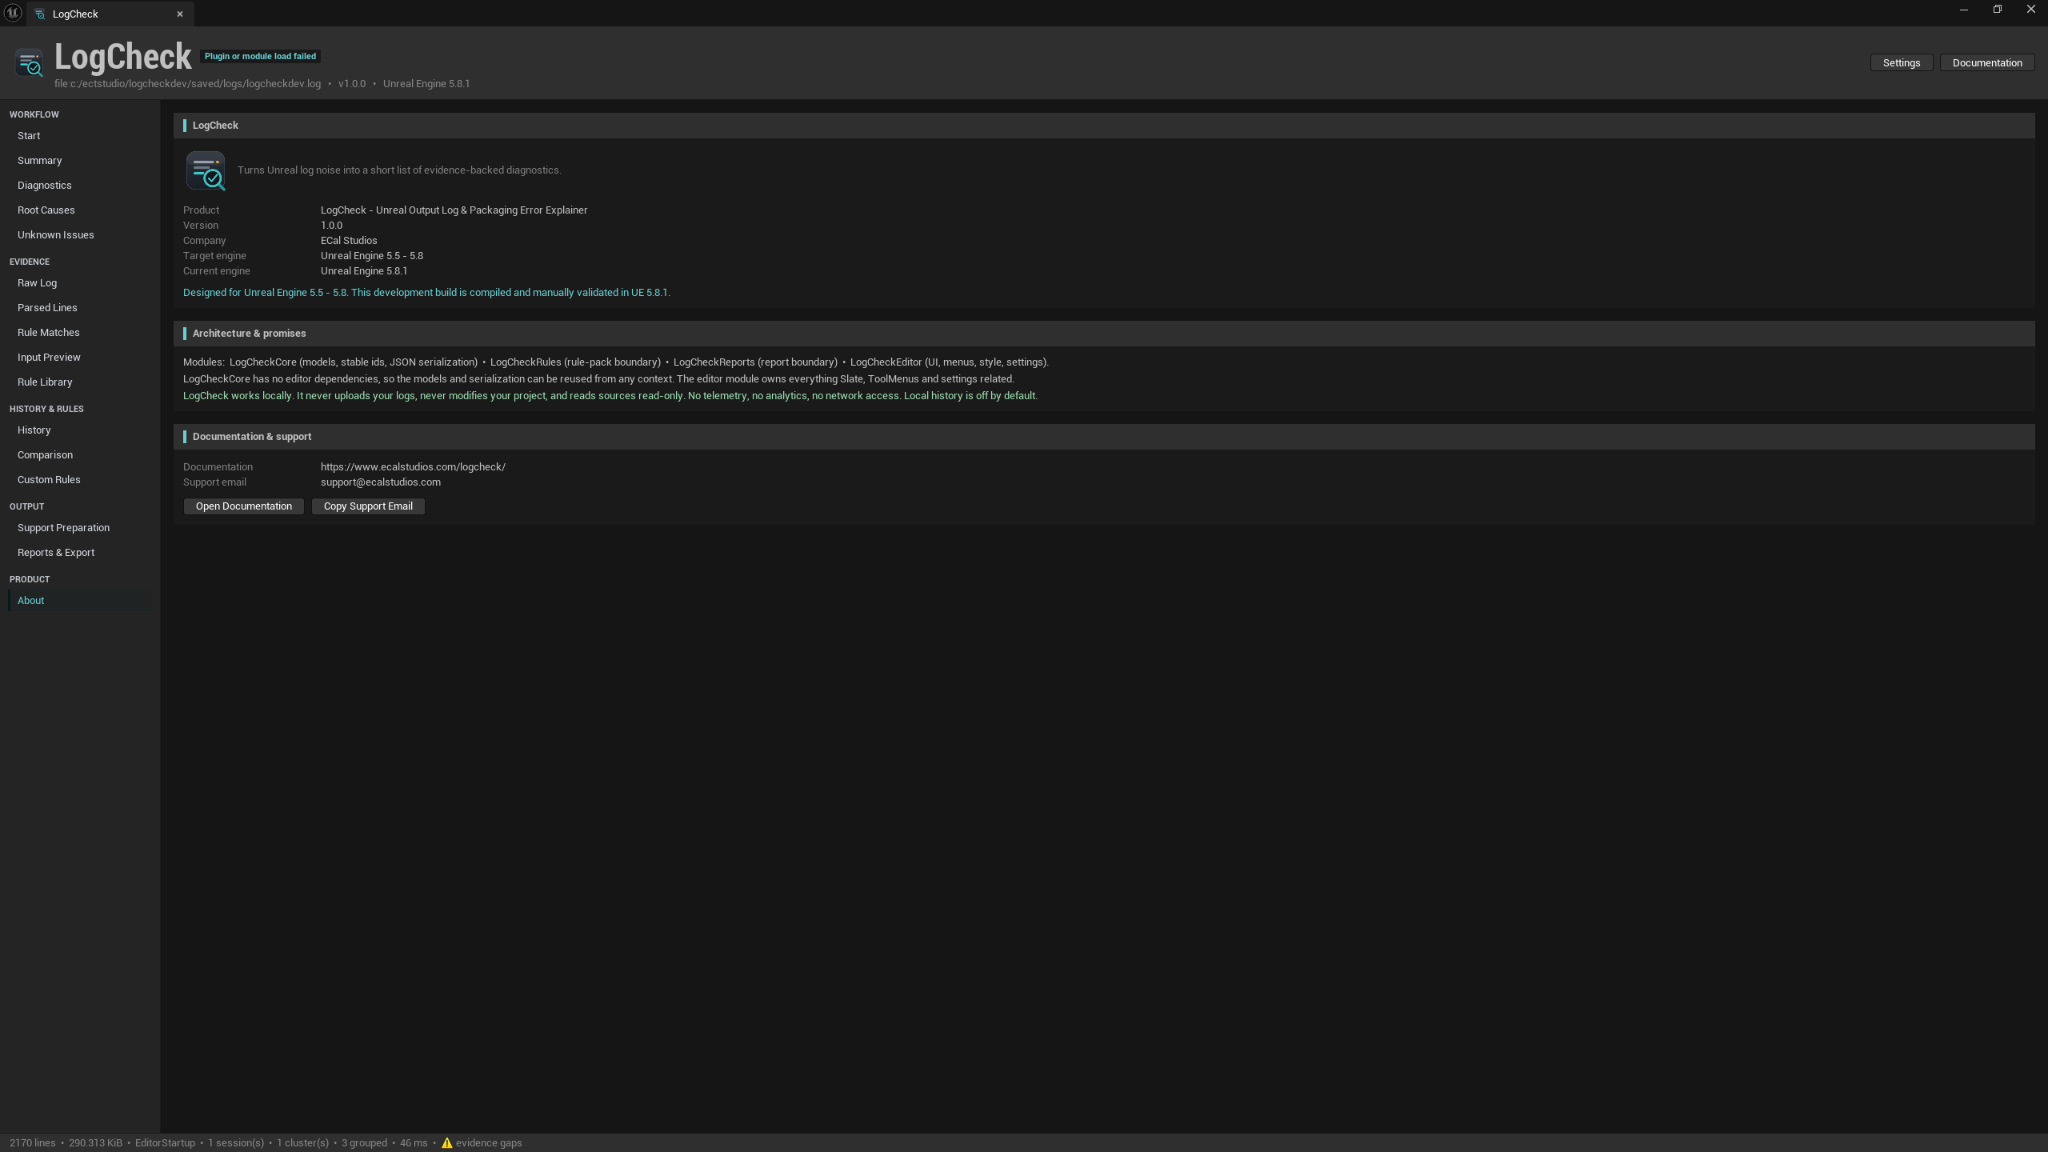
30. About and Version Information
The About page confirms the installed LogCheck version, supported Unreal Engine range, current engine version, editor-only architecture, local-data promises, documentation address, and support email. It is a useful first check when preparing a support request.